




Defence castings involve complex shapes, strict quality checks and lengthy customer approvals. These barriers can help qualified suppliers build lasting customer relationships.
This niche also creates room for specialised SME companies. Smaller manufacturers can enter defence supply chains by mastering particular components. They do not need to build complete defence systems.
However, SME investing carries risks. Specialised capabilities and defence customers do not guarantee financial strength. We therefore applied a quality screen to identify financially stronger businesses within the broader SME universe.
This article continues our series on such SMEs. Earlier instalments examined niche businesses, infrastructure suppliers and railway component makers. We now turn to precision manufacturers with defence supply links.
We required return on capital employed (ROCE) above 15%, both currently and on a three-year average. Debt-to-equity had to stay below 0.5. Operating cash flow had to be positive in the latest financial year. Sales and profit each needed three-year annualised growth above 10%.
Promoter holding had to exceed 30%, with no decline and no pledged shares. Companies also needed more than 100 shareholders and debtor days below 150.
Within this filtered pool, we identified three companies supplying defence castings and precision components. Each also serves other industries. Here is a closer look.
#1 Captain Technocast: Scaling Investment Castings And Defence Exposure
Incorporated in 2010, Captain Technocast deals in manufacturing and selling of investment castings.
Captain Technocast’s three-year sales compounded annual growth rate (CAGR) of 30% helped it qualify for the defence-castings shortlist. Profit CAGR was 58%, while ROCE stood at 29.7%.
The Rajkot company lists defence, aerospace and marine castings among its products. Its lost-wax casting and in-house machining facilities produce complex components. However, the annual report does not disclose defence revenue or a separate defence order book. Its exposure should therefore be viewed within a diversified casting business.
Increasing Capital Expenditure and Export Contributions
Investment across that business is increasing. The FY26 annual report records spending of Rs 19.1 crore on property, plant and equipment. This compares with Rs 5.64 crore a year earlier. Capital work-in-progress reached Rs 8.1 crore. The report provides no defence-specific expansion schedule.
Overseas sales also contributed to growth. Exports increased 34.4% to Rs 44.5 crore, accounting for around a third of consolidated revenue. Overall, FY26 consolidated revenue rose 40.9% to Rs 129.8 crore. Profit attributable to shareholders increased 44.5% to Rs 11.62 crore. The accounts imply an operating margin of 13%.
Strong Revenue Growth and Rising Borrowings
The higher investment brings funding requirements into focus. Borrowings rose from Rs 4.5 crore to Rs 20.1 crore. Debt-to-equity nevertheless remained within the screen’s limit at about 0.38 times. Operating cash flow stayed positive at Rs 8.2 crore, but fell 16.4%. FY26 debtor days stood at 67.
Meanwhile, promoter holding remained at 64.69% in June 2026, unchanged since March 2025. The company had 489 shareholders.
Future growth comparisons will need care. The report says Vartis Engineering is no longer a subsidiary following approval for its sale in June 2026. This changes the composition of the consolidated business. Past sales and profit growth should therefore not be extrapolated. Investors must also weigh SME liquidity risks and the longer gaps between half-yearly financial updates.
Captain Technocast Financial Performance
| Metric | FY26 |
| Revenue | Rs 129.8 crore |
| Revenue growth | 40.9% YoY |
| Net profit | Rs 11.6 crore |
| Profit growth | 44.5% YoY |
Source: Captain Technocast’s FY26 annual report
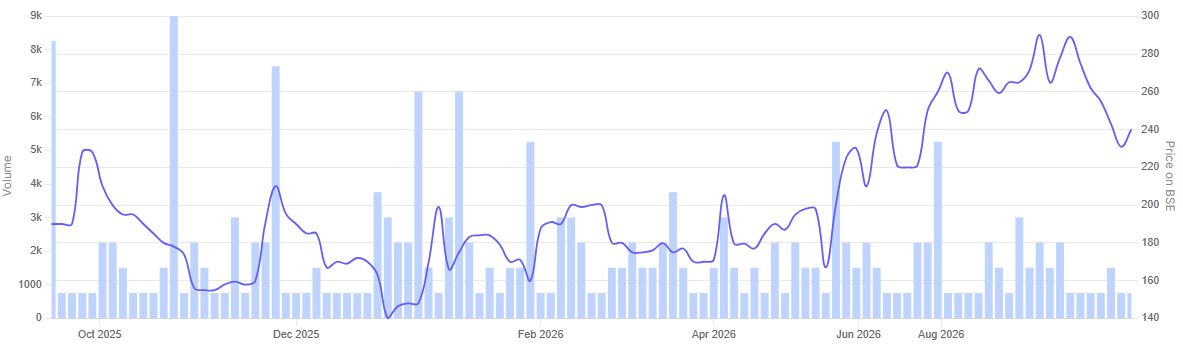
In the past year, the share price of Captain Technocast is up 26.3%.
Captain Technocast 1-Year Share Price Chart
Source: Screener.in
#2 Ameya Precision Engineers: Balancing Niche DRDO Supply Links with High Debtor Days
Incorporated in 1987, Ameya Precision manufactures pump and valve components and other engineering components used in valve Industry.
Ameya Precision Engineers recorded three-year sales and profit CAGRs of 12% and 44%, respectively. ROCE of 24.9% also supports its inclusion in the financial shortlist.
Its defence connection comes from supplying components to DRDO’s Armament Research and Development Establishment. The FY26 annual report puts this relationship at three to four years. However, defence generated only Rs 61.8 lakh in FY26, about 1.5% of revenue. Pumps and valves remain its main business.
The company manufactures shafts, precision components and wear-resistant overlays. Materials are tracked from raw stock to finished components. Exports accounted for 91.5% of FY26 operating revenue. Its markets include the UK, Europe and North America.
Assessing Expansion Plans and Slowing Cash Collections
For future expansion, Ameya is assessing development options for land at Sasewadi, near Pune. The property was acquired in FY25. The report gives no construction budget or commissioning date. Separately, 20% of its existing shop floor is reserved for future capacity additions.
FY26 revenue rose 4.3% to Rs 40.2 crore. Net profit increased 26.1% to Rs 5.6 crore. Operating margin was approximately 19%. Management attributes improved profitability to cost control, procurement planning and better resource utilisation.
Low Leverage and Strong Promoter Ownership Support
Low leverage provides some financial flexibility. Debt-to-equity was below 0.01 times. However, operating cash flow fell to Rs 1.95 crore from Rs 5.98 crore. Debtor days increased to roughly 115 from 73, highlighting slower collections.
Meanwhile, promoter holding rose to 72.45% in March 2026 from 72.29% a year earlier. Domestic institutional ownership stood at 4.05%, unchanged since September 2025.
Ameya’s financial credentials are clearer than its significance as a defence supplier. Latest sales and profit growth also trail their three-year CAGRs. Those historical rates should not be treated as forecasts. SME liquidity risks and half-yearly reporting warrant additional caution.
Ameya Precision Engineers Financial Performance
| Metric | FY26 |
| Revenue | Rs 40.2 crore |
| Revenue growth | 4.3% YoY |
| Net profit | Rs 5.6 crore |
| Profit growth | 26.1% YoY |
Source: Ameya Precision Engineers’ FY26 annual report
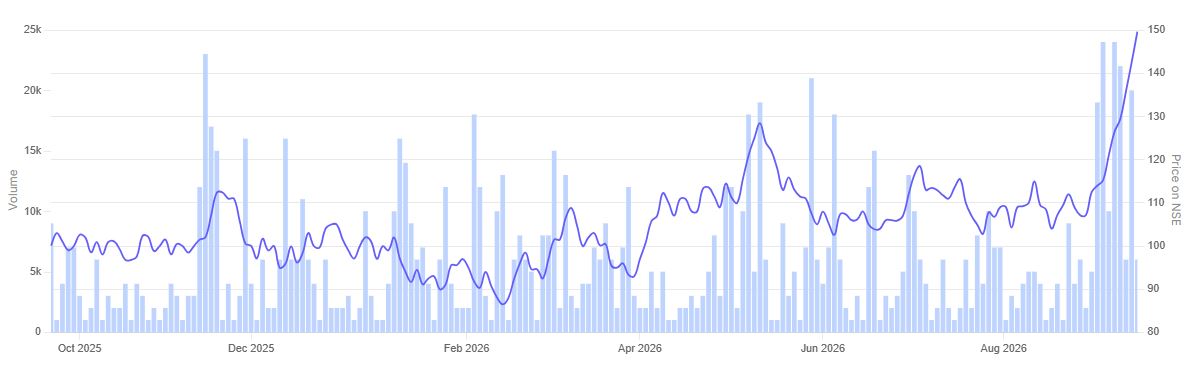
In the past year, the share price of Ameya Precision Engineers rallied 47.9%.
Ameya Precision Engineers 1-Year Share Price Chart
Source: Screener.in
Conclusion
Precision manufacturing gives specialised SMEs a place in defence supply chains. Captain Technocast and Ameya also have financial records that support their selection. However, their defence exposure needs perspective. Captain does not separately disclose defence revenue. For Ameya, it remains a small share of sales.
Future progress will depend on turning technical capabilities into repeat orders and cash flows. Rising borrowings at Captain and slower collections at Ameya deserve attention. Historical growth rates should not be treated as forecasts.
The financial screen offers a starting point for research. Valuations, execution and the scale of defence orders still need scrutiny. SME liquidity risks and half-yearly financial reporting call for added caution.
Two Precision Manufacturing SMEs: Growth and Operating Performance
| Metric | Captain Technocast | Ameya Precision Engineers |
| Three-year sales CAGR | 30% | 12% |
| Three-year profit CAGR | 58% | 44% |
| FY26 operating margin | 13% | 19% |
| FY26 debtor days | 67 | 115 |
| FY26 operating cash flow (₹ crore) | 8.24 | 1.95 |
Sources: Supplied Screener data for growth and debtor days. Margins and operating cash flow from the FY26 annual reports of Captain Technocast and Ameya Precision Engineers
Captain Technocast’s figures are consolidated. Ameya’s figures are standalone. Operating margins exclude other income.
You can track how these are progressing by adding stocks to your watchlist.
Disclaimer
Note: We have relied on data from www.Screener.in throughout this article. Only in cases where the data was not available, have we used an alternate, but widely used and accepted source of information.
The purpose of this article is only to share interesting charts, data points and thought-provoking opinions. It is NOT a recommendation. If you wish to consider an investment, you are strongly advised to consult your advisor. This article is strictly for educative purposes only.
Ekta Sonecha Desai has a passion for writing and a deep interest in the equity markets. Combined with an analytical approach, she likes to deep dive into the world of companies, studying their performance, and uncovering insights that bring value to her readers.
Disclosure: The writer and her dependents do not hold the stocks discussed in this article.
The website managers, its employee(s), and contributors/writers/authors of articles have or may have an outstanding buy or sell position or holding in the securities, options on securities or other related investments of issuers and/or companies discussed therein. The content of the articles and the interpretation of data are solely the personal views of the contributors/ writers/authors. Investors must make their own investment decisions based on their specific objectives, resources and only after consulting such independent advisors as may be necessary.