



An interesting divergence is happening in the Indian equity market right now. Although the headline indices may have struggled for meaningful progress, the broader market is still throwing up pockets of strength. This is more evident in the midcap space, where stock-specific momentum is creating opportunities for investors willing to look beyond Nifty 50.
In fact, the Nifty Midcap 100 gained 2.1% in August against a 1.2% decline in the Nifty 50, while analysts had expected midcaps and smallcaps to remain relatively stronger in September. The latest market action also suggests that stock selection remains crucial rather than simply taking a broad-market view.
Against this backdrop, four stocks are showing interesting breakout follow-through patterns on the chart.
The charts are based on a 1% × 3 Point & Figure (P&F) setup, which helps filter out smaller price fluctuations and focuses attention on meaningful demand-supply shifts.
1. Anthem Biosciences: Breakout Gets Follow-Through
Anthem Biosciences has delivered an interesting breakout structure. The stock had spent considerable time consolidating within a broad resistance zone before finally moving above it.
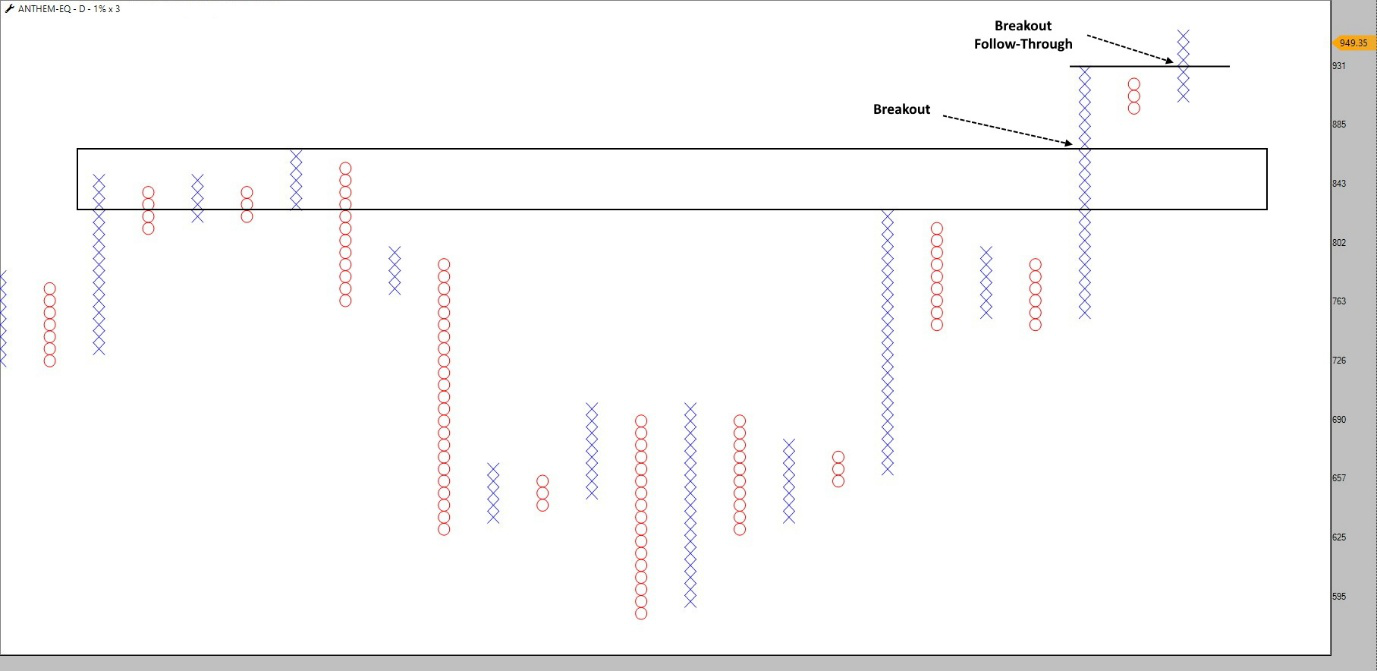
The first breakout came around the Rs.885 zone, signalling that buyers were beginning to overpower the supply visible in the earlier trading range. More importantly, the move did not immediately reverse. Instead, the stock continued higher and crossed the next important hurdle around Rs.931.
A breakout is one thing; a breakout followed by sustained movement in the same direction is quite another. The current price near Rs.949 indicates that the stock is attempting to build on its breakout rather than simply testing the resistance.
For investors the likely opportunity is whether this follow-through continues. A failure to hold above the breakout area would warrant caution, but continued strength could indicate that the previous resistance zone is gradually transforming into probable support.
2. IPCA Laboratories: Strong Breakout, Stronger Follow-Through
Ipca Laboratories is showing perhaps one of the cleaner structures among the four stocks.
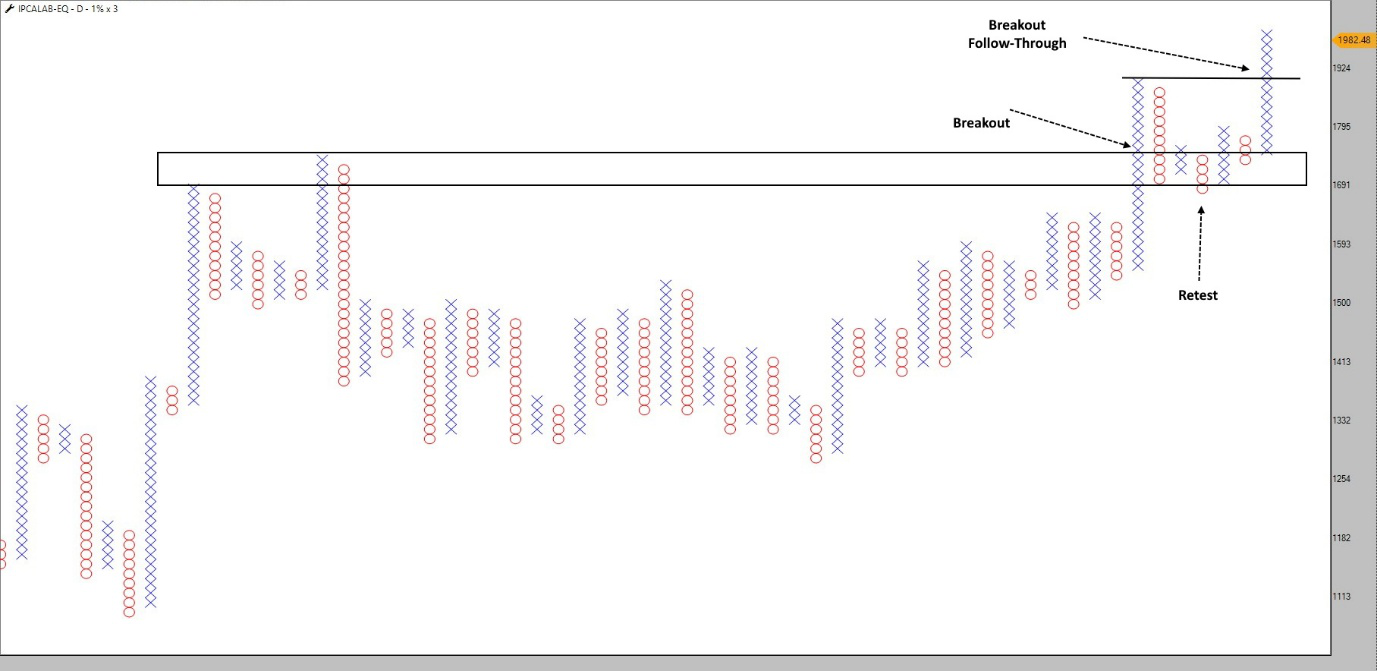
The stock spent an extended period moving sideways and repeatedly encountered supply around the Rs.1,690–Rs.1,750 zone. The eventual breakout above this congestion area marked a significant change in the price structure.
But again, the interesting part is what happened afterwards.
Instead of falling back into the range, IPCA Labs continued higher and crossed another important resistance level around Rs.1,924. The stock is currently trading around Rs.1,982 with good follow-through buying.
From a P&F perspective, this is an encouraging development because the breakout has been validated by subsequent price expansion. Investors may therefore watch whether the stock can sustain above the earlier breakout zone. If it does, the current structure presents a probable continuation opportunity, although chasing a sharp move without a suitable risk-management plan may not be ideal.
3. Lenskart Solutions – From Consolidation to Expansion
Another example is Lenskart Solutions, which shows how a consolidation phase can become a momentum move.
The stock was trading in a well-defined range around Rs 538-550.
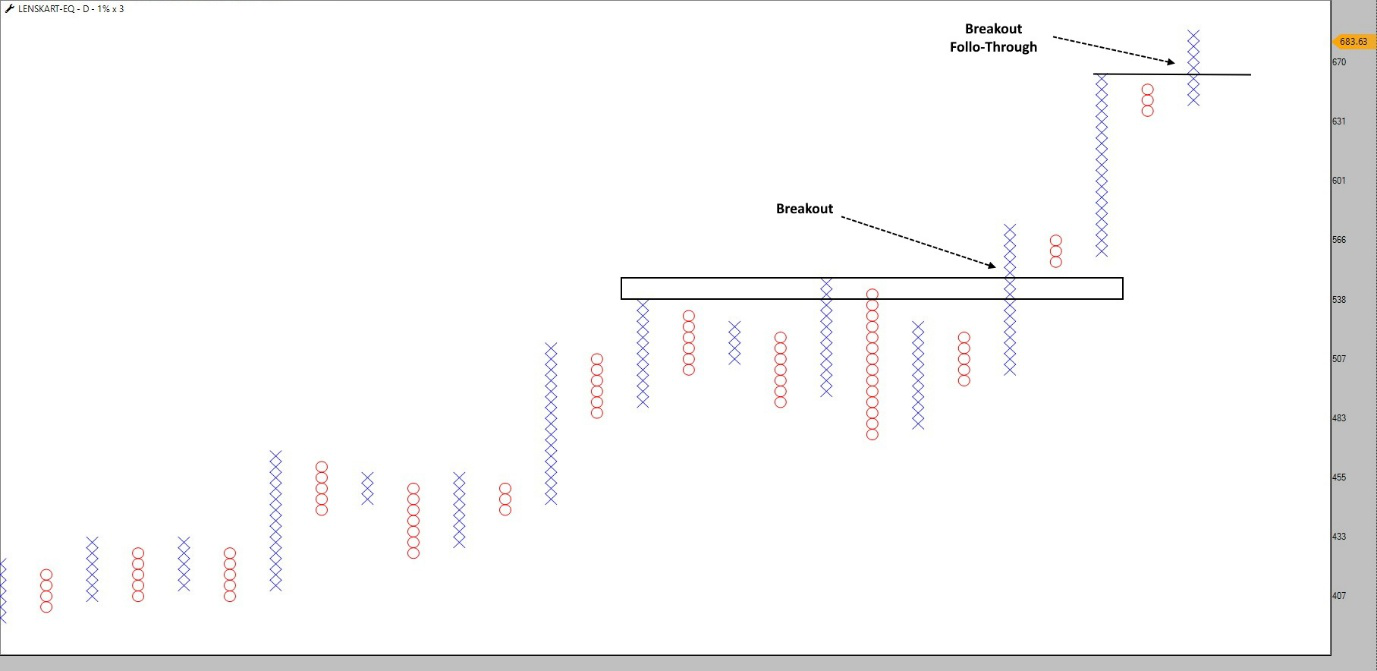
The significance of such ranges is that they are a fight between buyers and sellers. The eventual move above the upper boundary suggested that buyers had gained the upper hand.
The stock then moved towards the Rs.566–Rs.600 area before accelerating further. The subsequent breakout above the Rs.670 zone provided the follow-through confirmation.
With the stock currently around Rs.684, the structure remains bullish on the chart.
The important takeaway is that the opportunity is not merely the initial breakout. The breakout-follow-through combination makes the setup more interesting. In case of a stock pullback, investors can watch the Rs.670 area as a probable support zone holding up.
4. Bank of Maharashtra: Re-test and Bullish Follow-Through
Bank of Maharashtra has a slightly different and equally interesting setup.
The stock first broke above a long-standing resistance area around Rs.75. What makes this chart interesting is the subsequent retest. Instead of slipping back below the breakout zone, the stock found buying interest and resumed its upward movement.
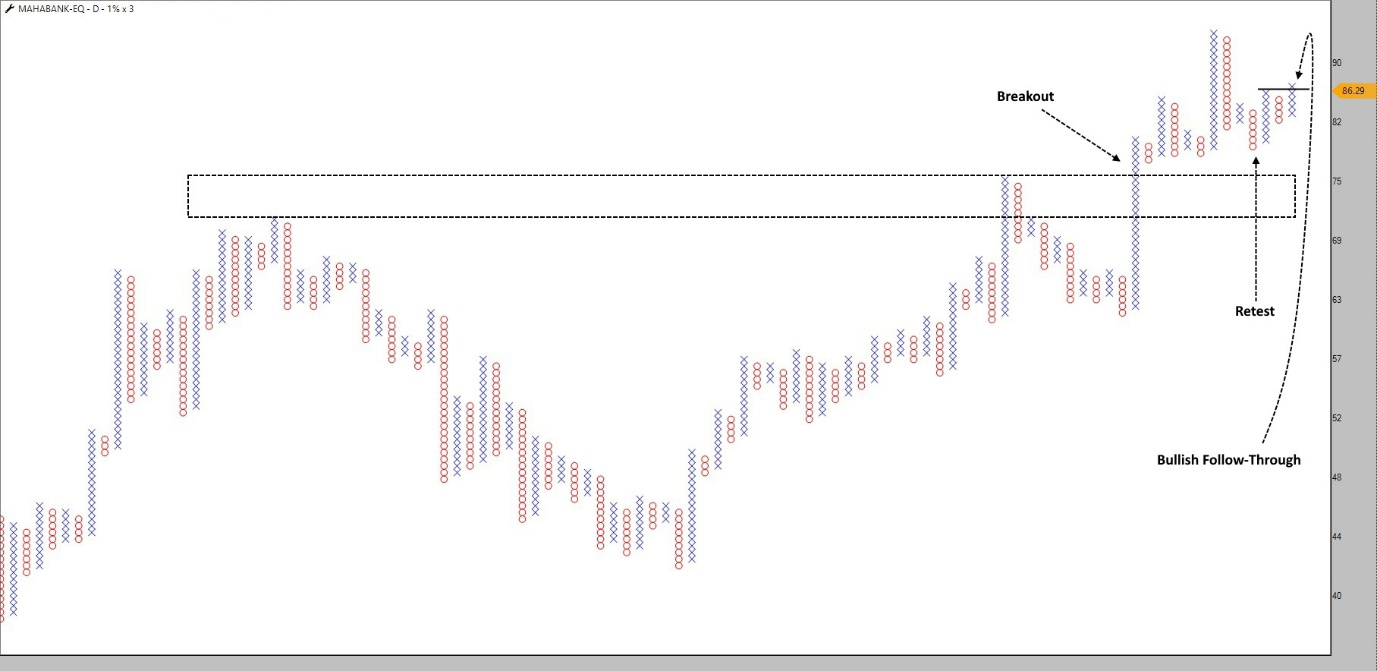
The stock then crossed the Rs.82–Rs.83 region, followed by another leg higher. It is currently around Rs.86.30.
This breakout-retest-follow-through sequence is often watched by technical traders because the retest provides an opportunity to assess whether former resistance is turning into support.
If the stock continues to hold above the breakout area, the structure remains probable bullish continuation, subject to market conditions.
The Bigger Picture: Follow the Strength, But Don’t Chase It
The broader market backdrop makes these setups particularly interesting. Midcaps have demonstrated relative resilience over recent months, even as largecaps have struggled to generate sustained momentum. However, September has also brought volatility, with the latest week seeing both Nifty and midcaps under pressure.
Anthem Biosciences, IPCA Laboratories, Lenskart Solutions and Bank of Maharashtra are showing such structures on their P&F charts. The continuation of this momentum remains probable, not guaranteed.
For investors, the smarter approach could be to track whether these stocks hold their breakout zones, sustain higher levels and continue attracting demand. In a market where the Nifty may remain range-bound, stock-specific strength could once again be where the real opportunities emerge.
Disclaimer:
Note: The purpose of this article is only to share interesting charts, data points and thought-provoking opinions. It is NOT a recommendation. If you wish to consider an investment, you are strongly advised to consult your advisor. This article is strictly for educative purposes only.
Brijesh Bhatia is an Independent Research Analyst and is engaged in offering research and recommendation services with SEBI RA Number – INH000022075. He has two decades of experience in India’s financial markets as a trader and technical analyst.
Disclosure: The writer and his dependents do not hold the stocks discussed here.
The website managers, its employee(s), and contributors/writers/authors of articles have or may have an outstanding buy or sell position or holding in the securities, options on securities or other related investments of issuers and/or companies discussed therein. The content of the articles and the interpretation of data are solely the personal views of the contributors/ writers/authors. Investors must make their own investment decisions based on their specific objectives and resources, and only after consulting such independent advisors if necessary.