




Debt is often viewed as a red flag on a company’s balance sheet. But more leverage doesn’t necessarily mean a company is under pressure. The key is to evaluate what the company has done with that debt and whether its growth and cash-generating ability are robust enough to support the higher borrowing.
For some businesses, debt can be a tool to accelerate expansion, build capacity, enter new markets or fund acquisitions. If borrowing rises alongside sales, profits and returns on capital, the picture can be very different from that of a company taking on debt simply to sustain a weak business.
That is what makes some of the fastest-growing stocks with rising leverage worth a closer look. Over seven years, these companies have not only seen their debt increase substantially, but have also maintained strong business momentum and profitability.
The focus is on companies with a market capitalisation above Rs 10,000 crore, sales growth of more than 15% over seven years and more than 20% over five years, while maintaining at least 15% growth over three years. They have also delivered more than 20% profit growth over five years and remain profitable.
But growth alone is not enough to make higher debt comfortable. The companies here have seen debt rise to more than twice its level seven years ago, while maintaining Return on Capital Employed (ROCE) above 15%, interest coverage of more than five times, and debt-to-equity above 0.8.
In other words, these are businesses where leverage has risen meaningfully, but so have the scale and earnings of the underlying operations, making the question less about whether they have debt and more about whether that debt has helped create growth without putting their financial health under undue pressure.
#1 Genus Power Infrastructures: From Meter Maker To Smart Metering Play
Genus Power Infrastructures Ltd. has evolved significantly from being a manufacturer of electricity meters and dealing in power infrastructure projects. The company now has expanded into smart metering and the Advanced Metering Infrastructure Service Provider (AMISP) business. Today, it is involved across the smart-metering chain, including meters, communication systems, software, and long-term operations and maintenance services.
The company scaled its business almost 4.5 times in the past seven years using leverage. During the period, borrowings of the company increased sharply, from roughly Rs 276 crore in FY2019 to about Rs 2,302 crore in FY2026. While the sales grew from Rs 1,055 crore to Rs 4,751 crore during the period. The company has needed more capital as its smart-metering projects have scaled up.
The company has a debt-to-equity (D/E) ratio of 1.04x, compared to the industry median of 0.4x , while its interest coverage ratio stood at 5.73x, lower than the industry median of 7.5x.
Genus Power used the debt not only to scale its business but to make the business genuinely profitable, which is reflected in its net profit growing from Rs 48 crore in FY19 to Rs 592 crore in FY26.
Smart Metering Keeps The Growth Engine Running
Genus Power’s AMISP business involves designing, installing, financing, and operating smart-metering projects, creating the possibility of recurring sales through long-term contracts.
The opportunity remains large as India continues to replace conventional electricity meters with smart meters. Genus Power has expanded its manufacturing capacity to more than 18 million meters a year and has been scaling project execution across states.
Genus Power was the first Indian company to implement a Narrowband-IoT setup for Advanced Metering Infrastructure in partnership with Vodafone Idea.
The major shift came in 2022, when Genus Power began participating as an AMISP under the TOTEX model and started offering end-to-end deployment, operation, and maintenance of smart-metering systems.
The company also partnered with GIC, Singapore, to establish a platform for smart-metering projects.
Furthermore, Genus Power received US$49.5 million from the US International Development Finance Corporation (DFC) to support smart-meter deployment.
Alongside electricity smart meters, Genus Power expanded into new product lines such as smart gas meters, water meters and data loggers. During FY2026, the company crossed the 1 crore smart-meter installation mark, underlining the rapid expansion of its smart-metering business.
A Large Order Book Supports The Next Phase
As of 30 June 2026, the total order book of the company stood at Rs 24,020 crore (net of taxes, offering long-term sales visibility.
The management of the company expects sales to further increase in FY27 up to Rs 6,500 crore. The company is also targeting to complete the installation of 1 crore smart meters in this fiscal year.
45% jump in sales in Q1FY27
The growth of the company continues in Q1FY27 as well, as the sales for the quarter increased 45% YoY from Rs 942 crore in Q1FY26 to Rs 1,365 crore. Profit for the period increased from Rs 128 crore to Rs 163 crore, logging a 27% YoY growth.
Available at a discount?
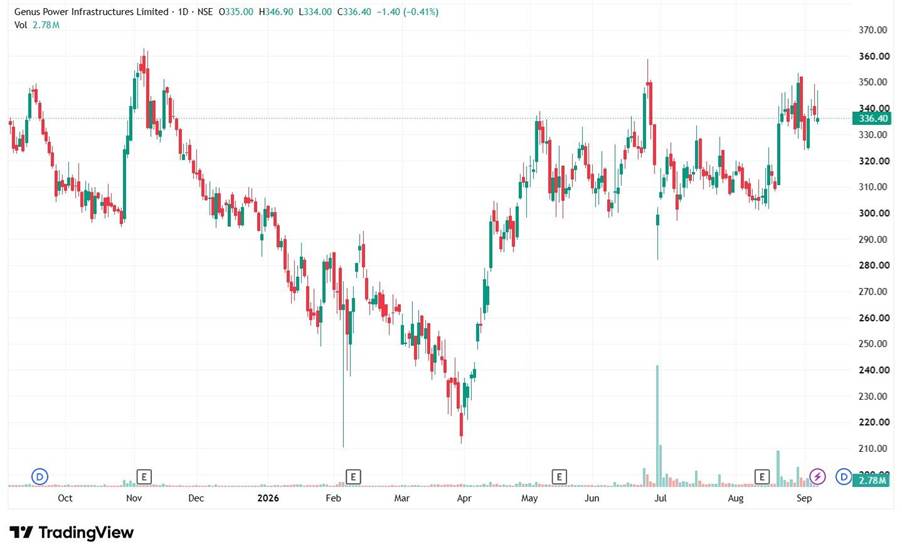
The stock is trading at a price/earnings (PE) ratio of 15.7x, which is lower than the industry median of 25.6x, while its price/earnings to growth (PEG) ratio stood at 0.09x, lower than the industry median of 0.23x, indicating that the stock is relatively undervalued.
1-Year Share Price Chart of Genus Power Infrastructure Ltd.
#2 Titan Company: Growth Across A Consumer Franchise
Titan Company Ltd. has expanded from a traditional jewellery and watches business to a full-fledged jewellery, watches, eyewear, fragrances, bags, and Indian dresswear business. The jewellery segment includes brands like Tanishq, Mia, Zoya, and CaratLane. Furthermore, Titan has gone global with its recent acquisition of Damas in FY26.
Between FY2019 and FY2026, Titan has scaled its business more than 4 times, with sales increasing from Rs 19,779 crore in FY2019 to Rs 87,584 crore in FY2026. The net profit rose from Rs 1,389 crore to Rs 5,073 crore during the period.
The growth came along with an increase in borrowings, which went up sharply from Rs 2,393 crore to Rs 30,621 crore, reflecting that the company used leverage to scale up and diversify its business over these years.
Titan has a D/E ratio of 1.95x, against the industry median of 0.5x, and its interest coverage ratio was at 7.2x, slightly lower than the industry median of 7.3x.
Jewellery Remains The Biggest Growth Driver
Jewellery continues to be at the centre of Titan’s growth story. The company added a net of 33 stores during the quarter ended on 30 June 2026, expanding its domestic store network further. Apart from adding new stores, the company has been focusing on premiumisation and introducing new product categories as well.
During Q1FY27, sales from Tanishq, Mia and Zoya together grew 38% to Rs 15,502 crore, while CaratLane’s sales grew 41% to Rs 1,441 crore, indicating the benefit of operating leverage as the business scales.
Despite the company operating at such a robust scale, the jewellery market share remains in single digits. However, the management believes the company can achieve a double-digit market share in the medium to long-term.
Growth Beyond Jewellery
Titan has been using its leverage to diversify its business significantly, and that is reflected in the growing contribution from other business segments over these years. Domestic sales from watches grew 21.8% YoY to Rs 1,510 crore in Q1FY27, supported by premiumisation in the analog segment, and the same from the EyeCare segment increased 22% as well during the period to Rs 285 crore.
CaratLane is another important part of the expansion story. The business is growing rapidly across both online and offline channels, with studded jewellery continuing to perform well. Management expects CaratLane’s EBIT margin to gradually move towards double digits as the business scales further.
Strong Q1 Keeps The Growth Story Intact
Sales stood at Rs 21,356 crore in Q1FY27, up 29.3% YoY from Rs 16,523 crore a year ago, while profit increased 63% YoY to Rs 1,777 crore from Rs 1,091 crore during the period.
Already trading at a premium?
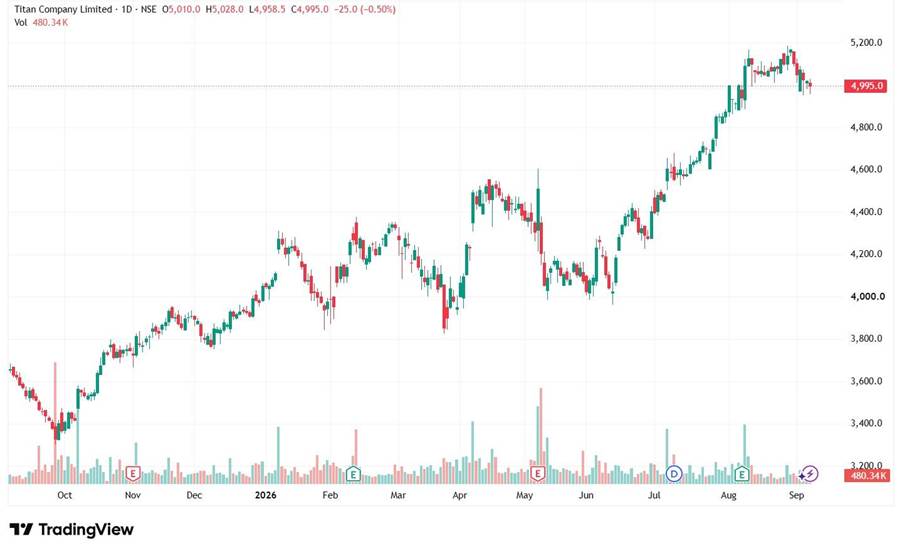
The stock is trading at a PE ratio of around 76x, while the industry median is 18x. The PEG ratio stood at 4.6x, relatively higher than the industry median of 0.3x, indicating that the stock is relatively expensive compared to its peers, even if adjusted for growth.
1-Year Share Price Chart of Titan Company Ltd.
#3 Lumax Auto Technologies: The Shift From Auto Components To Future Mobility
Lumax Auto Technologies Ltd. is one of the leading manufacturers of gear shifters and automobile interiors, with more than 65% market share across passenger vehicle manufacturers in India. Having said that, the company has been steadily diversifying beyond traditional auto components and venturing into advanced plastics, mechatronics, telematics, structures and control systems, alternate fuels and aftermarket services.
The shift is visible as sales have risen from Rs 1,187 crore in FY2019 to Rs 4,870 crore in FY2026, while net profit has climbed from Rs 69 crore to Rs 337 crore over the same period.
The company used financial leverage to fuel the growth, which is reflected in the rising debt in the balance sheet. From Rs 70 crore in FY2019, total borrowings increased to Rs 1,231 crore in FY2026.
Lumax Auto has a debt-to-equity (D/E) ratio of 1.02x, while the industry median is 0.4x, and the interest coverage ratio stood at 5.5x, lower than the industry median of 7.14x.
The Real Change Is Happening Inside The Product Mix
The most interesting part of Lumax is not simply the growth in sales, but where the next leg of growth is expected to come from.
Though advanced plastics remains the largest revenue contributor, accounting for 56% of sales during the April-June quarter, which also grew 47% YoY to Rs 769 crore, the share of Mechatronics is beginning to stand out. Sales from this segment grew 56% YoY to Rs 84 crore in the quarter, with an order book of Rs 483 crore. Management expects the division to generate around Rs 400 crore of sales in FY27 and sees the potential to reach close to Rs 1,000 crore by FY31.
This is where Lumax’s future mobility strategy becomes important. The company is adding sensors, antennas, telematics, electronic control units and body control modules to the portfolio. The Bengaluru Smart Hub for Innovation & Future Trends (SHIFT) centre is working on software-defined vehicles, ADAS and connected-vehicle technologies. Management said five completely new products are expected to be launched over the next 18 to 24 months, with the Body Control Module already entering the market.
The aim is effectively to capture more value from every vehicle rather than simply sell more components.
Growth Is Coming From Existing Customers Too
Apart from adding new segments, the company is also focused on enhancing the services for the existing customers. Management highlighted four key drivers for improving existing business relations, which are higher wallet share with existing original equipment manufacturers (OEMs), premiumisation, localisation, and new technology.
This strategy of the company seems to be playing out as sales from Maruti Suzuki grew 48% YoY with Mechatronics during Q1FY27. Greenfuel Energy is benefiting from new models, localisation and higher wallet share.
Expansion and Order Book Growth
The company is adding capacity to fuel the growth. A new plant is being built at Chakan to cater to Mahindra & Mahindra, while a large Mechatronics facility in Manesar is expected to be commissioned by Q3. Greenfuel is also setting up a new Nashik facility after onboarding Mahindra as a customer for CNG delivery systems in passenger vehicles.
The capacity expansion supports the growing order book of the company as well. At the end of Q1FY27, the total order book stood at Rs 1,600 crore. Of this, around 24% is expected to be executed in this fiscal year, while the next 56% over FY28 and the remaining 20% in FY29.
Business growth continues in Q1FY27.
Sales during the quarter surged 33% YoY from Rs 1,026 crore in Q1FY26 to Rs 1,364 crore in Q1FY27. Profit grew by 83% YoY from Rs 54 crore to Rs 99 crore during the period.
Already at a premium?
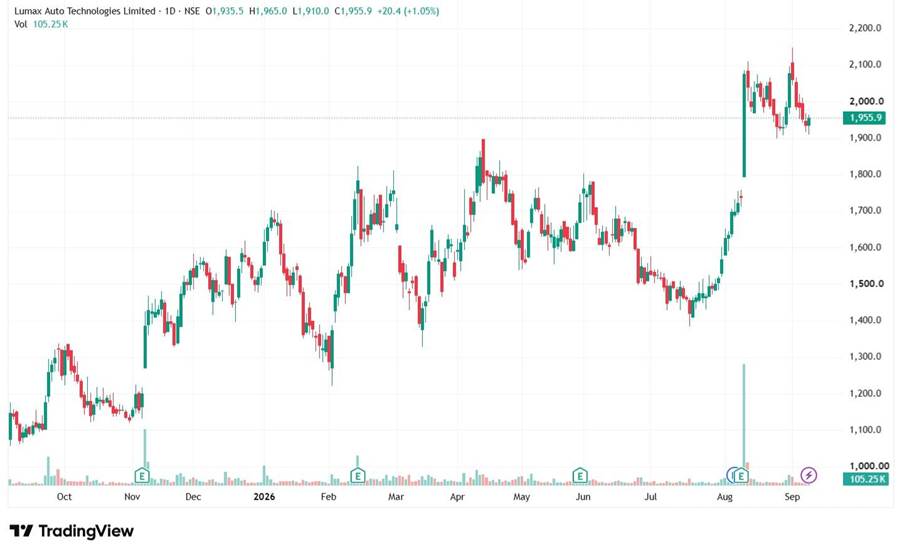
The stock is trading at a PE of 40.3x, compared to the industry median of 29.6x; however, its PEG ratio is at par with the industry median of 0.9x. This indicates the stock might be relatively more expensive than its peers.
1-Year Share Price Chart of Lumax Auto Technologies Ltd.
So, Is Debt that Bad?
Though debt is often viewed as a weakness on the balance sheet, these companies show how leverage can become a key tool for business growth if deployed wisely. These companies have taken on debt while simultaneously scaling sales, profits, capacities, and new business lines.
For investors, the important question will be whether the strategy adopted by these companies can continue to work as the base gets larger. If additional borrowing continues to create capacity, open new revenue streams, and boost earnings faster than the financial burden, leverage can remain a growth accelerator rather than a balance-sheet risk. But if growth slows while debt continues to rise, the same leverage can quickly turn into a drag.
So, to understand whether debt continues to work in the favour of the business, whether the leverage is helping the business become more profitable, you need to add these stocks to your watchlist for now.
We have relied on data from www.Screener.in throughout this article. Only in cases where the data was not available have we used an alternate, but widely used and accepted source of information.
The purpose of this article is only to share interesting charts, data points, and thought-provoking opinions. It is NOT a recommendation. If you wish to consider an investment, you are strongly advised to consult your advisor. This article is strictly for educational purposes only.
Maumita Mitra is a seasoned writer specializing in demystifying the world of investment for a broad audience. She has a keen eye for detail and a knack for explaining complex financial concepts in the simplest manner possible.
Disclosure: The writer and her dependents do not hold the stocks discussed in this article.
The website managers, its employee(s), and contributors/writers/authors of articles have or may have an outstanding buy or sell position or holding in the securities, options on securities, or other related investments of issuers and/or companies discussed therein. The content of the articles and the interpretation of data are solely the personal views of the contributors/ writers/authors. Investors must make their own investment decisions based on their specific objectives and resources, and only after consulting such independent advisors as may be necessary.