




For investors looking beyond companies with a long history of strong growth, a more interesting set of businesses may be those where growth itself is accelerating. A company that is growing faster today than it did over the longer term can indicate a shift in demand, capacity, market share, or the contribution of newer business opportunities.
The trend becomes more meaningful when the improvement in growth is accompanied by healthy profitability and disciplined use of capital. Companies that are able to accelerate revenue while maintaining operating margins and generating strong returns on capital may have a different growth profile from businesses that are simply benefiting from a favourable cycle.
With this in mind, we looked for companies where the latest sales growth is higher than the three-year growth rate, which in turn is higher than the five-year and seven-year growth rates. In effect, there is an acceleration in growth over various time periods. We also screened the stocks for recent profit growth that is higher than their three-year profit growth, while filtering for a return on capital employed above 15% and operating margins above 10%.
Then we further narrowed to companies with market capitalization between Rs 500 crore and Rs 30,000 crore, debt-to-equity (D/E) ratio below 0.75x, no pledged promoter shares, and no significant decline in promoter holding over the past three years.
The result is a group of companies where the recent growth trajectory, profitability, and balance-sheet profile point to a potentially changing business story, and we will explore three of those companies in this piece.
#1 HBL Engineering: Kavach Emerges As A Major Growth Engine
HBL Engineering Ltd. is a technology-driven engineering company that develops niche products for varied industries. Its portfolio spans industrial batteries, defence products, and industrial electronics, including Kavach train protection systems. The company uses in-house research and development to fill in the technology gaps present in the domestic market and to explore engineering-intensive niches and multiple specialised markets to expand the business.
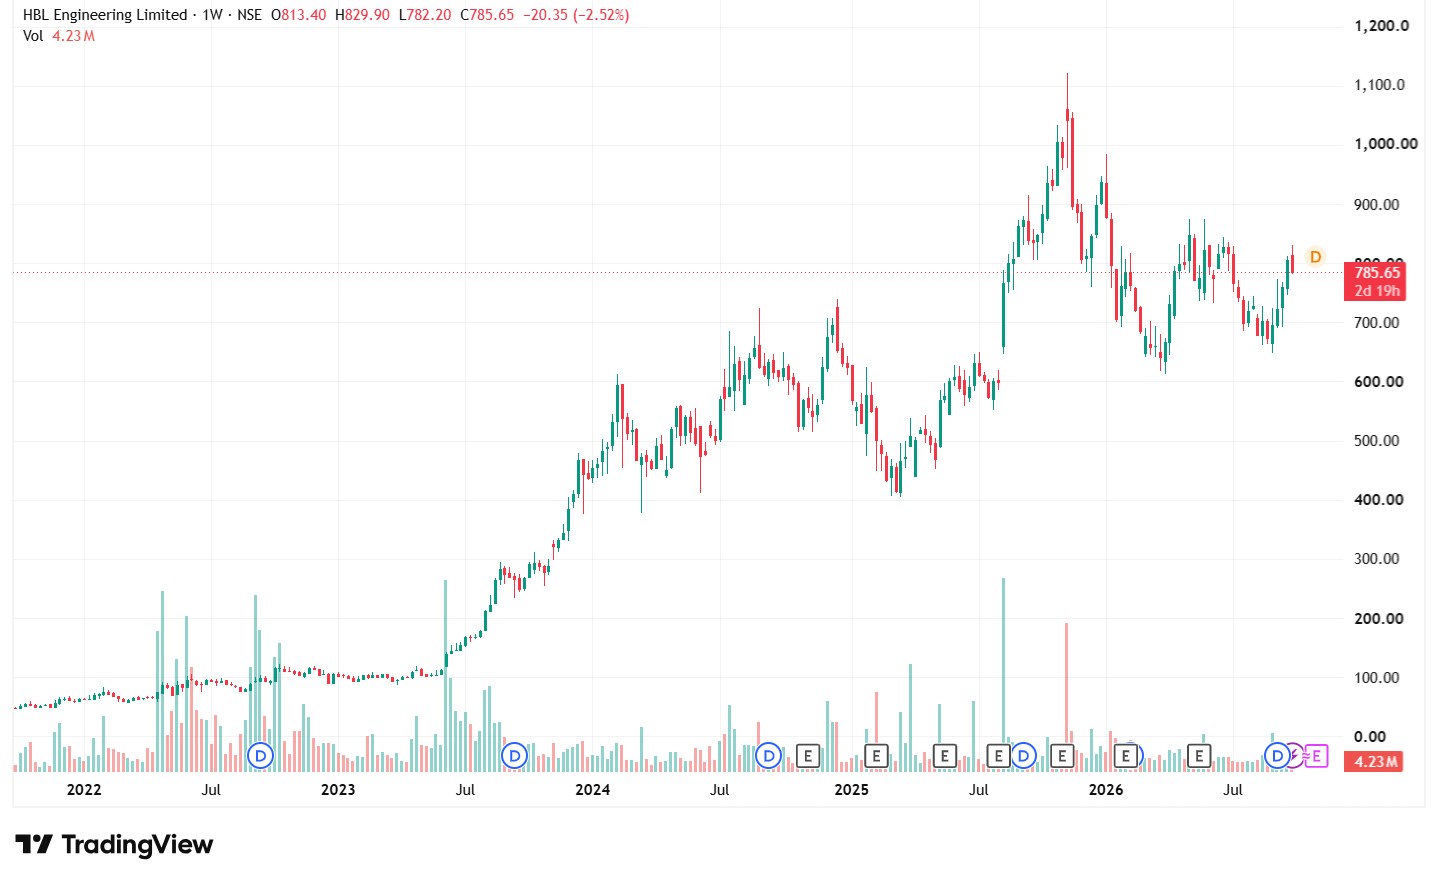
Over the past three years, consolidated revenue of the company grew from about Rs 1,369 crore in FY23 to Rs 3,303 crore in FY26, while profit increased from Rs 99 crore to Rs 815 crore. That translates into revenue growth of about 141% and profit growth of more than 723% over three years.
The sharp improvement has been driven primarily by the electronics business, particularly Kavach. HBL’s competitive advantage in Kavach comes from being the pioneer in developing the system with the active support of the Research Designs and Standards Organisation (RDSO).
In terms of execution of contracts received, HBL stands out to be the leader in the market as of FY26, and the company expects the market structure to favour the leading participants as competition increases.
This gives HBL an important position as the rollout of Kavach expands across the railway network. However, the company has also cautioned that contract types, competitive bidding and execution timelines can lead to significant quarter-to-quarter variation in revenue and margins.
Capacity, New Businesses Add To The Pipeline
Apart from Kavach, the company witnessed strong demand for Nickel Cadmium batteries and Pure Lead Thin (PLT) batteries during the period as well.
The company is expanding Nickel Cadmium battery capacity for domestic and export markets. During FY26, the company witnessed around 15% growth in the export of these batteries despite disruptions across logistics channels driven by the West Asia crisis.
HBL is also ramping up its PLT battery production capacity, which has been doubled during FY26. In India, HBL is the only manufacturer of Lead PLT batteries.
Beyond existing businesses, HBL expects electric drive-train pilot sales for 55-tonne trucks from July 2027, subject to approvals.
The company also entered into a joint venture with Cochin Shipyard for electric maritime propulsion and has also secured an initial battery order for two electric tugs.
Q1 Growth Slows, But Electronics Remains Key
In Q1FY27, consolidated sales rose 6% YoY to Rs 638 crore from Rs 601.8 crore a year ago. Profit, however, declined by 24% YoY to Rs 109 crore from Rs 143.35 crore during the period.
Having said that, revenue from the electronics segment grew to Rs 227.3 crore from Rs 180.4 crore during the period, logging a 26% YoY growth. On the other hand, revenue from the industrial batteries segment rose to Rs 362 crore from Rs 337 crore, growing at 7.4% YoY. Defence and Aviation, however, dragged the revenue down as the segment’s revenue declined to Rs 38 crore from Rs 74 crore a year ago.
Valuation
The stock is trading at a price/earnings (P/E) ratio of 27.2x, at par with the industry median. However, the price/earnings to growth (PEG) ratio stands at 0.26x, lower than the industry median of 0.85x, reflecting that the stock might be relatively undervalued compared to its peers.
5-Year Share Price Chart of HBL Engineering Ltd.
#2 Deep Industries: Stronger Growth, Rs 3,047 Crore Order Book Support Outlook
Deep Industries Ltd. is the largest natural gas compression service provider offering processing, drilling, and workover rigs, integrated project management, production enhancement, and offshore services. The company has expanded across the oil and gas value chain, with 20 onshore rigs and more than 80 gas processing units.
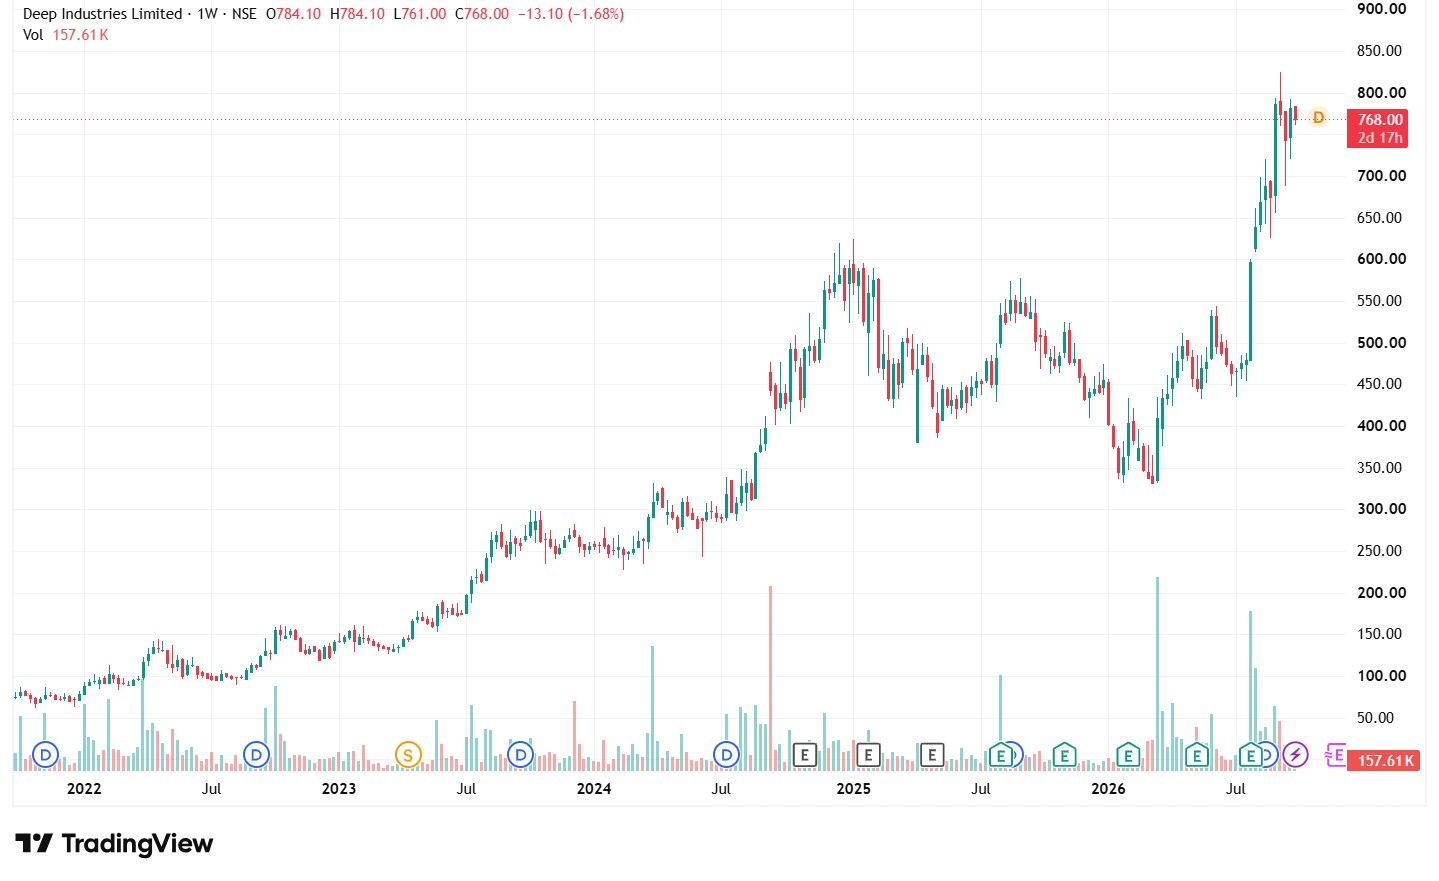
The business has delivered a sharp improvement in scale over the past three years. Consolidated revenue increased from Rs 341 crore in FY23 to Rs 891 crore in FY26, translating into a rise of around 161%. Profit after tax also increased from Rs 125 crore to Rs 197 crore during the same period, a growth of around 57.6%.
Production Enhancement, Drilling Drive Growth
One of the key long-term opportunities that the company received during this period was a Rs 1,402 crore, 15-year contract from ONGC for production enhancement at a mature oil and gas field. The company expects the contract to involve specialised equipment and techniques to increase hydrocarbon production and extend the life of the field.
The company is also exploring higher-capacity drilling rigs amid rising demand for onshore drilling services. Its offshore business is another growth avenue, with the Prabha-DP2 accommodation barge having started generating revenues.
Rs 3,047 Crore Order Book and 45% Jump in Profit
Deep Industries ended the June quarter with an order book of Rs 3,047 crore. During the quarter, the company received fresh orders worth Rs 319 crore, while executing orders worth Rs 279 crore.
During Q1 FY27, consolidated revenue of the company grew by 39.8% YoY to Rs 279 crore from Rs 199.5 crore a year ago. Profit during this period surged by 44.5% to Rs 89.1 crore from Rs 61.7 crore in the corresponding quarter last fiscal year, indicating continued business growth.
Valuation
The stock is trading at a P/E of 11.9x, lower than the industry median of 17.7x, indicating the stock might be relatively cheaper than its peers, but its PEG ratio stands at 0.19x, at par with the industry median.
5-Year Share Price Chart of Deep Industries Ltd.
#3 Pricol: Earnings Scale Up As New Products, Capacity Add To Growth
Pricol Ltd. is one of the largest instrument cluster manufacturers across the globe with domestic market share of around 60% and 65% in the two-wheeler segment. The company has expanded from its core driver information systems business into actuation, control, and fluid management systems, and precision products for the automotive industry. The company supplies ancillary products across two-wheelers, passenger vehicles, commercial vehicles, tractors, and off-road vehicles, with operations in India and overseas.
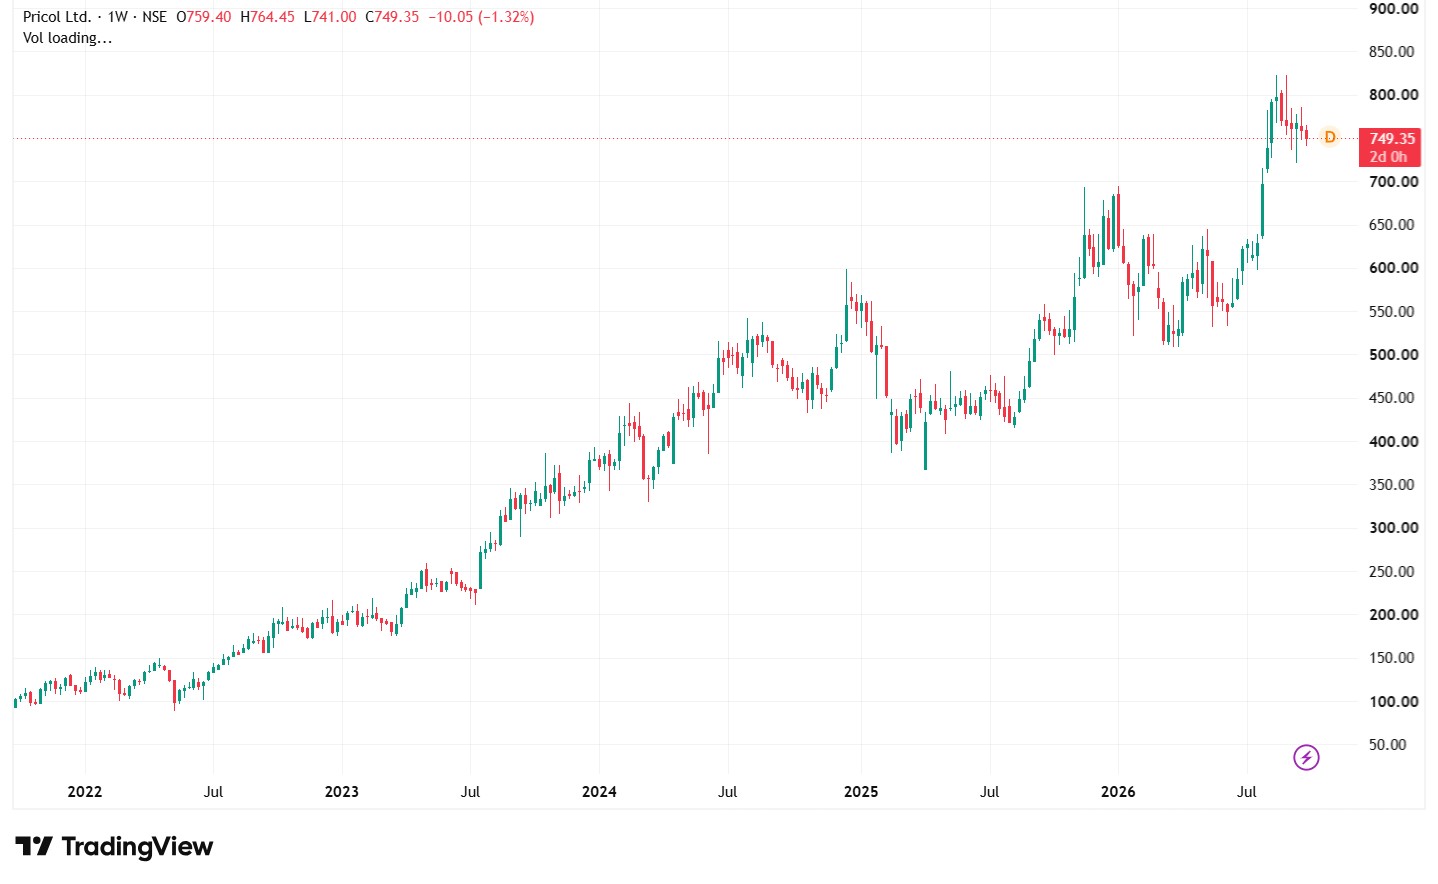
The company has delivered strong growth over the last three years. Consolidated revenue increased from Rs 1,903 crore in FY23 to Rs 3,964 crore in FY26, a rise of around 108.3%. Profit increased from Rs 125 crore to Rs 251 crore, doubling during the period.
New Products Expand Growth Opportunities
Introduction of new products and expansion across business verticals have been at the core of Pricol’s business growth. Its product portfolio includes TFT and LCD clusters, telematics, battery management systems, electric coolant pumps, oil pumps, switches, disc brakes, and other precision components.
Coming to the capacity expansion, management has outlined a Rs 700 crore capital expenditure programme over the next 18 to 24 months, out of which Rs 400 crore is reserved for the polymer business expansion. Another Rs 150 crore to Rs 180 crore is reserved for Driver Information and Connected Vehicle Solutions (DICVS), and around Rs 120 crore for Actuation, Control and Fluid Management Systems (ACFMS).
Management expects the polymer business to achieve 2.5 times the FY25 revenue over the next three years. They also expect the DICVS segment to grow at least 5% above the market growth, while for the ACFMS business they are targeting 10% above market growth.
Demerger Creates Focused Businesses
Pricol has proposed demerging its DICVS business into Pricol Autotech. The business segment contributed to around 61.17% of consolidated turnover for FY26, worth around Rs 2,424.6 crore. According to the company, this demerger can help in creating focused businesses with greater flexibility to raise capital, attract technology partners, and pursue their respective growth opportunities.
Q1 FY27 Growth Stays Strong
The momentum continued in Q1FY27, and the consolidated revenue increased 23.5% YoY to Rs 1,083.6 crore from Rs 877.7 crore in Q1FY26. During the period, EBITDA rose 21.4% to Rs 123.7 crore from Rs 101.87 crore a year ago. Profit for the period grew 34.3% to Rs 67 crore, from Rs 49.9 crore in the corresponding quarter in the previous fiscal year.
Management said the company has won business that is currently constrained by capacity, with new capacity expected to mature over the next 9 to 12 months. It also said new product introductions helped Pricol’s two-wheeler business grow 28% in Q1FY27, ahead of industry growth of about 23%.
Valuation
The stock is trading at a P/E ratio of 34.3x, while the industry median is at 29.2x. Even the PEG ratio stands at 1.2x, higher than the industry median of 0.9x, reflecting that the stock might be relatively expensive compared to its peers.
5-Year Share Price Chart of Pricol Ltd.
Can The Growth Momentum Sustain?
The acceleration seen so far has been supported by a combination of stronger demand, new business opportunities, rising order visibility, product additions, and investments in capacity. The next phase, however, will depend on how effectively these companies convert those opportunities into sustained revenue and profit growth.
Execution of large orders, ramp-up of new capacities, optimum utilization of the existing capacities, and the contribution from newer businesses will be key to determining whether the recent improvement in growth can be sustained over the coming quarters. With multiple growth triggers already in place, these stocks could be worth adding to your watchlist.
Disclaimer
We have relied on data from www.Screener.in throughout this article. Only in cases where the data was not available have we used an alternate, but widely used and accepted source of information.
The purpose of this article is only to share interesting charts, data points, and thought-provoking opinions. It is NOT a recommendation. If you wish to consider an investment, you are strongly advised to consult your advisor. This article is strictly for educational purposes only.
Maumita Mitra is a seasoned writer specializing in demystifying the world of investment for a broad audience. She has a keen eye for detail and a knack for explaining complex financial concepts in the simplest manner possible.
Disclosure: The writer and her dependents do not hold the stocks discussed in this article.
The website managers, its employee(s), and contributors/writers/authors of articles have or may have an outstanding buy or sell position or holding in the securities, options on securities, or other related investments of issuers and/or companies discussed therein. The content of the articles and the interpretation of data are solely the personal views of the contributors/ writers/authors. Investors must make their own investment decisions based on their specific objectives and resources, and only after consulting such independent advisors as may be necessary.