




India’s dental industry is moving beyond clinics and hospitals towards a larger manufacturing opportunity in dental materials, consumables, prostheses and laboratory products. Grand View Research estimates India’s dental equipment and consumables market generated USD 2.09 billion in 2024 and is projected to reach USD 3.62 billion by 2030, implying a compound annual growth rate (CAGR) of 9.6% during 2025-30. Importantly, dental consumables were the largest product segment in 2024, making this the most relevant pool for Indian manufacturers rather than the broader dental-services market.
The consumables opportunity becomes even more significant when viewed separately. Grand View Research estimates India’s dental consumables market at USD 1.73 billion in 2025, with revenue projected to reach USD 3.63 billion by 2033, representing a 9.7% CAGR from 2026-33. Dental implants were the largest segment in 2025, while dental biomaterials are projected to be the fastest-growing segment. There is also a sizeable laboratory manufacturing opportunity.
The opportunity is therefore not restricted to imported equipment. India is building domestic capabilities across dental materials, biomaterials, prostheses, aligners and laboratory products. This is where manufacturing-led listed companies such as Laxmi Dental and Prevest DenPro fit into the expanding dental value chain.
#1 Laxmi Dental: Where Laboratory Scale Meets Digital Dentistry
Laxmi Dental Limited operates across dental laboratory solutions, aligners and paediatric dental products. Its largest business is dental laboratory solutions, operated primarily through Illusion Dental Lab, which provides customised dental prostheses such as crowns and bridges. Its aligner business includes Illusion Aligners and Taglus, with Taglus manufacturing thermoforming sheets, 3D-printing resins, machines and accessories used in orthodontic applications. Kids-e-Dental is its paediatric dental business and serves more than 15 countries.
Q1 FY27: Growth Came From the Core Engine
Laxmi Dental reported its highest-ever quarterly revenue in Q1 FY27, with consolidated revenue from operations of ₹74.70 crore, up 13.9% year on year (YoY) and 1% quarter on quarter (QoQ). Earnings before interest, taxes, depreciation and amortisation (EBITDA) increased 20.6% to ₹14.36 crore, taking EBITDA margin to 19.2%, while profit after tax (PAT), after the share of profit/loss from joint ventures, rose 23.8% to ₹10.32 crore. PAT margin improved to 13.8% from 12.7% in Q1 FY26.
The quality of this growth is more important than the headline number. Laboratory revenue increased to ₹50.28 crore from ₹44.59 crore, while laboratory revenue excluding scanner sales grew 23.5%. International laboratory operations grew 37.4%. Aligner Solutions revenue increased to ₹24.17 crore from ₹18.73 crore, while its segment result rose to ₹6.53 crore from ₹2.28 crore.
Within the aligner segment, Bizdent and Vedia grew 27.8% and 29.3%, respectively, during Q1 FY27. If the higher-margin aligner business continues to grow faster than laboratory solutions, it could gradually lift consolidated profitability even if overall revenue growth remains moderate.
The Scanner Question Is More Important Than Scanner Sales
Scanner revenue fell to ₹2.2 crore in Q1 FY27 from ₹5.9 crore a year earlier. However, management has consistently described scanners as a strategic enabler of digital dentistry rather than simply a hardware revenue stream.
The issue is therefore not whether scanner revenue grows every quarter. It is whether scanner deployment produces a larger pool of laboratory and aligner revenue over time.
The company’s earlier disclosures indicate that scanner sales typically carry lower margins, while the laboratory and aligner businesses have stronger economics. Q1 FY27’s higher gross margin of 78.6% therefore benefited from the lower contribution of scanners.
Five-Year Growth Hides a Margin Question
| Particulars | FY22 | FY23 | FY24 | FY25 | FY26 |
| Sales (₹ in crores) | 137 | 162 | 194 | 239 | 278 |
| Operating Profit (₹ in crores) | 7 | 9 | 24 | 43 | 44 |
| Net Profit (₹ in crores) | (19) | (4) | 25 | 32 | 29 |
Revenue almost doubled between FY22 and FY26. Revenue increased from ₹239 crore in FY25 to ₹278 crore in FY26, but operating profit increased by only ₹1 crore, while PAT declined. FY26 showed that revenue expansion alone did not guarantee higher earnings, making operating leverage the key metric to track.
Palghar Could Change the Economics
The company is moving towards an owned manufacturing facility at Palghar, Maharashtra, alongside three new support facilities in India. That could change more than Laxmi Dental’s capacity. An owned facility could give the company greater control over manufacturing, automation and operating costs as volumes scale.
If Laxmi can ramp utilisation without a proportionate increase in employee and laboratory costs, Palghar could improve operating leverage and support higher volumes over time. The key variables to watch are commissioning, utilisation and incremental revenue generation, because these will determine whether the expansion translates into better returns on capital.
Debt Is No Longer the Immediate Constraint
Laxmi had nil consolidated borrowings as of 31 March 2026, following repayment of its remaining term loan during FY26. This gives the company room to fund expansion without starting FY27 with conventional debt on the balance sheet.
However, debt-free does not mean capital-light. The company is investing in machinery, facilities, digital systems and international operations. The more useful measure will therefore be free cash flow after expansion spending and the return generated on the additional capital.
The International Opportunity Comes With Concentration Risk
Laxmi serves 22,000+ dental clinics, dental companies and dentists across more than 320 Indian cities and exports to 95+ countries. FY26 export revenue for custom-made dental prostheses, aligners and allied products stood at ₹96.54 crore, primarily serving the US, UK and European markets.
Exports therefore represent a meaningful growth channel, but the geographic mix also introduces tariff, currency and market-specific risks. Earlier company disclosures showed India at 68% of revenue, the US at 19%, the UK at 7% and other markets at 6% in H1 FY25.
The US market has also been a source of volatility. Earlier management commentary highlighted the effect of US tariff uncertainty on the business.
The Stock, Valuation and Broker View
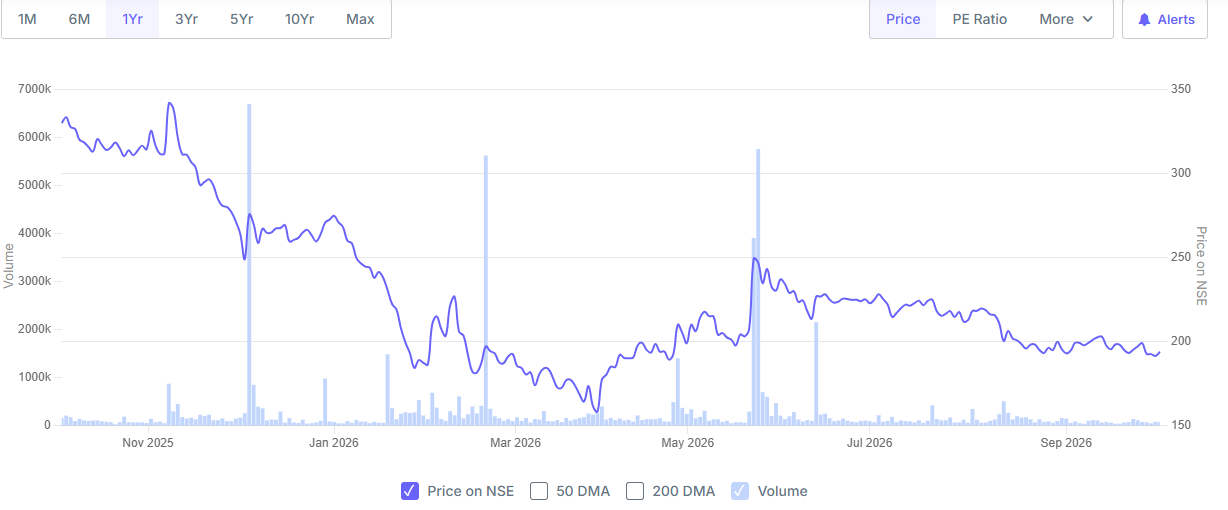
Laxmi Dental’s share price surged around 13% over the last six months but fell around 27.5% on a year-to-date basis. The company had a price-to-earnings (PE) ratio of 30.67. The stock closed at ₹193.87 on 1 October 2026 on the National Stock Exchange of India (NSE).
Motilal Oswal maintained a Buy rating on Laxmi Dental and set a target price of ₹280 per share. The brokerage said Q1FY27 revenue was broadly in line with expectations, while EBITDA and PAT beat estimates by 11% and 14%, respectively.
At ₹193.87, the market is valuing Laxmi at a materially higher multiple than a slow-growth manufacturing company would normally command, so future earnings growth and margin expansion become central to the valuation argument.
#2 Prevest DenPro: The Dental Materials Play With Different Economics
Prevest DenPro is an Indian dental-materials manufacturer covering research, product development, manufacturing and marketing of dental consumables. Its portfolio includes adhesives, bonding agents, etchants, cements, composites, endodontic products, finishing and polishing products and other clinical materials.
The Prevest Research Institute, established in 2020, focuses on dental biomaterials, physical and chemical characterisation, clinical evaluation, clinical investigation and patient safety. This makes Prevest structurally different from Laxmi. Whereas Laxmi has a substantial patient-specific laboratory and aligner component, Prevest is primarily a product-manufacturing business. Its economics are therefore more closely linked to product volumes, export distribution, manufacturing efficiency, R&D productivity and the ability to launch and scale new products.
Q1FY27 Shows Operating Leverage
Prevest DenPro started FY27 with consolidated revenue from operations of ₹19.07 crore, up 20.94% YoY and 0.67% QoQ. Consolidated EBITDA increased 24.73% YoY to ₹8.08 crore, while PAT increased 27.99% YoY to ₹5.64 crore. Sequentially, PAT fell 3.14%.
Consolidated total expenses increased only 2.30% QoQ to ₹12.82 crore, even though material consumption rose to ₹4.80 crore from ₹3.76 crore in Q4FY26.
EBITDA and PAT grew faster than revenue, indicating that the company was able to absorb growth without a proportional increase in its overall cost base.
Prevest has only one reportable operating segment under AS 17, so it does not publish separate revenue or profit by business segment.
3D Printing Could Become More Than a Side Business
Management’s FY26 commentary disclosed that 3D printer sales increased 162% YoY and 3D printing resin sales increased 40.5%. The company is working towards developing a fully indigenous 3D printer by 2028. It has also commercialised its disinfectant business and continues to develop its Oradox oral-care portfolio, with plans for two or three new Oradox products during FY27.
Printers can build an installed base that could drive recurring demand for specialised resins and other consumables. However, the indigenous-printer programme also introduces development and execution risk. Its investment value will depend on commercialisation, product acceptance and the eventual recurring consumables opportunity rather than the launch itself.
Five Years Reveal a More Stable Profit Engine
| Particulars | FY22 | FY23 | FY24 | FY25 | FY26 |
| Sales (₹ in crores) | 38 | 50 | 56 | 63 | 72 |
| Operating Profit (₹ in crores) | 15 | 20 | 20 | 22 | 26 |
| Net Profit (₹ in crores) | 12 | 16 | 16 | 18 | 21 |
The company has moved from a smaller revenue base to a larger one while continuing to convert a meaningful portion of sales into operating and net profit. The next phase will therefore depend on whether it can scale revenue without putting pressure on margins, cash flows or capital efficiency.
Debt-Free Does Not Mean Cash-Flow Risk Is Zero
Prevest remained debt-free as of 31 March 2026, with no long-term or short-term borrowings and no finance cost during Q1 FY27. Standalone cash and cash equivalents stood at ₹72.65 crore, compared with ₹60.46 crore a year earlier.
FY26 standalone operating cash flow was ₹15.86 crore, compared with ₹14.98 crore in FY25. Investing cash flow was negative ₹2.47 crore, largely because of fixed-asset purchases and investments, while financing cash flow was negative ₹1.20 crore, primarily due to dividend payments.
The more useful metric is cash conversion. FY26 operating cash flow was about 76% of the ₹21 crore reported net profit. That is positive, but it also means readers should continue monitoring receivables, inventory and working-capital requirements as the export business expands.
Export Growth Is Both Opportunity and Risk
Prevest sells its products in 90+ countries across Europe, the Americas, Asia, Africa, and the Middle East. Its FY25 geographical revenue mix shows Europe contributing 49% of revenue, followed by Asia at 27% and the Middle East at 18%. South America, North America and Africa contributed 3%, 2% and 0.1%, respectively.
Prevest has been trying to reduce dependence on individual export markets. Its US business expanded through Axiodent Inc., its wholly owned US subsidiary, while the UAE subsidiary Prevest DenPro Gulf General Trading LLC was established to strengthen its Middle East presence. Management said FY26 US business grew 37.58%, helped by Axiodent and private-label activity, while UAE commercial operations were delayed by Middle East geopolitical disruptions.
In the future, it is important to see whether its subsidiaries and private-label strategy can reduce concentration while maintaining regulatory and distributor efficiency across multiple markets.
The Stock Has Corrected While Earnings Continue to Grow
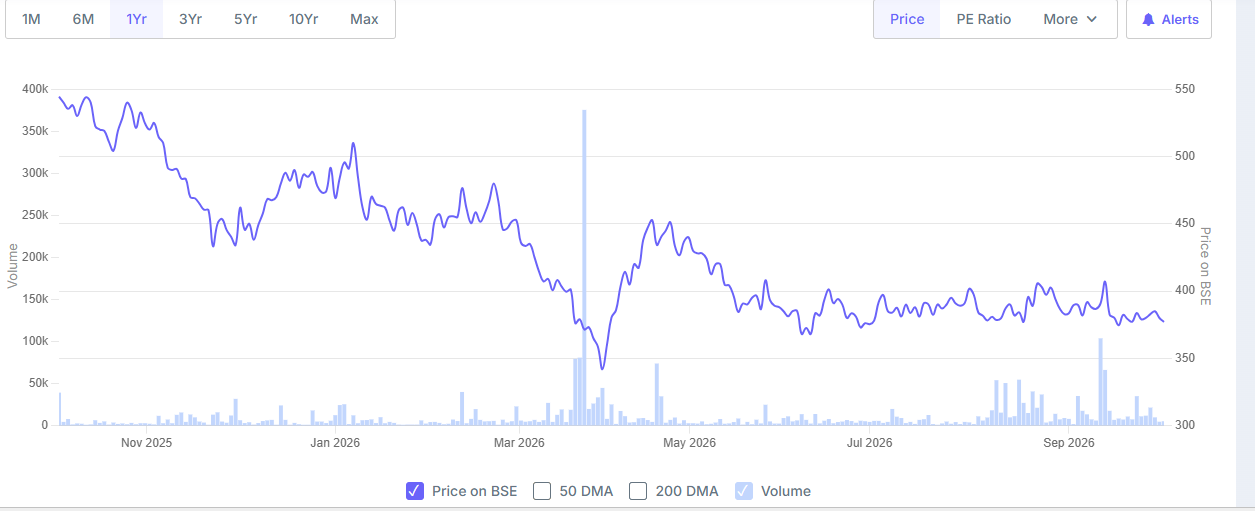
Prevest DenPro’s stock was trading around ₹377.05 on 1 October 2026. The shares had gained more than 4.5% over six months but remained down more than 23% in 2026, indicating that the recent recovery had not reversed the year’s decline. The trailing PE was around 21x on the same date. The company had not received a brokerage rating in recent years.
Where the Dental Opportunity Can Break
The biggest operational challenge for listed dental manufacturers is converting a fragmented, specialised market into scalable manufacturing economics. Raw materials such as polymers, resins, ceramics, metals, acrylics and chemicals can expose margins to input-price and currency movements. Laxmi Dental’s raw-material purchases increased to ₹51.15 crore in FY26 from ₹37.25 crore in FY25, showing the material scale of this cost base.
For patient-specific products such as prostheses and aligners, maintaining quality becomes harder as production increases. More orders can mean more remakes, rejected products or delays if manufacturing processes cannot keep up. Companies also need to keep investing in intraoral scanners, computer-aided design/computer-aided manufacturing (CAD/CAM) systems, 3D printers, software and skilled technicians to meet growing demand.
Regulatory compliance, product approvals and the availability of specialised technical talent could become equally important as these businesses scale across markets. For patient-specific products, maintaining quality and turnaround times while increasing volumes will also determine whether additional capacity actually improves economics.
The Next Chapter: When Dental Growth Meets the Market’s Patience
For readers, the next phase will be less about discovering the dental opportunity and more about judging whether it can translate into shareholder returns. The upcoming quarterly results should be read for changes in earnings quality rather than revenue alone: look for broad-based profit growth, cash generation that keeps pace with accounting earnings, and controlled working-capital intensity.
Equally important is the market’s response to execution. A strong operating quarter may already be reflected in valuations, leaving less room for disappointment. Investors should therefore compare earnings growth with the multiple being paid, track management’s delivery against stated timelines, and watch whether incremental investments begin producing measurable returns.
It may be a good idea to add these stocks to your watchlist and keep track to see how they perform in time to come.
Disclaimer:
Note: We have relied on data from www.Screener.in throughout this article. Only in cases where the data was not available, have we used an alternate, but widely used and accepted source of information.
The purpose of this article is only to share interesting charts, data points and thought-provoking opinions. It is NOT a recommendation. If you wish to consider an investment, you are strongly advised to consult your advisor. This article is strictly for educative purposes only.
Rishabh Sinha is a seasoned financial content creator with over 10 years of experience in BFSI domain. His portfolio spans over 20 of India’s most trusted financial brands. Rishabh brings depth, structure, and a reader-first approach to every piece he crafts.
Disclosure: The writer and his dependents do not hold the stocks discussed in this article.
The website managers, its employee(s), and contributors/writers/authors of articles have or may have an outstanding buy or sell position or holding in the securities, options on securities or other related investments of issuers and/or companies discussed therein. The content of the articles and the interpretation of data are solely the personal views of the contributors/ writers/authors. Investors must make their own investment decisions based on their specific objectives, resources and only after consulting such independent advisors as may be necessary.