



A Tale of Two Tata Giants: Profit Growth Meets a 52-Week Low
On 11th September 2026, two companies from the Tata Group hit fresh 52-week lows. Tata Consumer Products fell to Rs 988 before closing at Rs 991. Rallis India touched Rs 200.5 and closed at Rs 202. One is a Nifty 50 name worth Rs 98,078 cr. The other is a smallcap worth Rs 3,928 cr.
The pairing is strange because neither company is in trouble. Both reported double-digit profit growth for the June 2026 quarter. Both owe very little. Both raised their dividend for FY26. These are the names investors claim they want when prices fall.
So, the question is not whether the businesses are sound. It is whether the market is repricing the business or simply repricing the multiple. Those are very different things, and these two stocks give very different answers. Let us take them one at a time.
#1 Tata Consumer Products: The Pivot from Tea to Mainstream FMCG
Incorporated in 1962 as Tata Tea, Tata Consumer Products is the group’s food and beverages arm. It sells tea, salt, spices, coffee and packaged foods, and took its present shape in 2020, absorbing Tata Chemicals’ consumer business and moving from tea into mainstream FMCG. Market cap is Rs 98,078 cr and promoters hold 33.83%.
The shareholding tab tells the clearest story. Foreign institutional investors (FIIs) held 25.46% in March 2024. By June 2026 that was down to 20.08%. Over the same stretch, domestic institutions climbed from 17.39% to 24.99%.
Those two lines describe a handover: foreign money has been leaving for eight straight quarters and Indian funds have absorbed every share of it. Retail left too, with the shareholder count down from 9.63 lakh in December 2024 to 7.91 lakh in June 2026.
Decoding the 8-Quarter Foreign Fund Exodus
| Financial Year | FY21 | FY22 | FY23 | FY24 | FY25 | FY26 | 5-yr CAGR |
| Sales (Rs Cr) | 11,602 | 12,425 | 13,783 | 15,206 | 17,618 | 20,290 | 12% |
| EBITDA (Rs Cr) | 1,544 | 1,719 | 1,856 | 2,284 | 2,479 | 2,792 | 13% |
| Net Profit (Rs Cr) | 930 | 1,015 | 1,320 | 1,215 | 1,287 | 1,547 | 11% |
EBITDA here means operating profit before other income. Sales compounded at close to 12% a year, EBITDA at about 13% and net profit at roughly 11%. No one-off items hide in those rows. Other income in FY26 was just Rs 145 cr against operating profit of Rs 2,792 cr, so the profit is the business earning it.
The problem is not growth. It is what the growth earns. Return on equity is 7.35% and return on capital employed 9.24%. Put Rs 100 of capital into this business and it hands back roughly Rs 9 of operating profit a year. For a branded consumer name, that is thin.
The balance sheet is in fine shape. Borrowings were Rs 2,820 cr against reserves of Rs 21,689 cr, a debt-to-equity ratio near 0.13. Free cash flow hit a record Rs 2,016 cr in FY26, and the working capital cycle has shrunk from 122 days a decade ago to 8 days.
High Price, Thin Returns: The 59.5x Valuation Disconnect
The stock has compounded at about 3% a year over five years, against 22% over ten. That tells you when the re-rating happened, and when it stopped. At Rs 991 the share trades 23% below its 52-week high of Rs 1,283. Even so, it is priced at 59.5 times earnings and 4.5 times its book value of Rs 220.
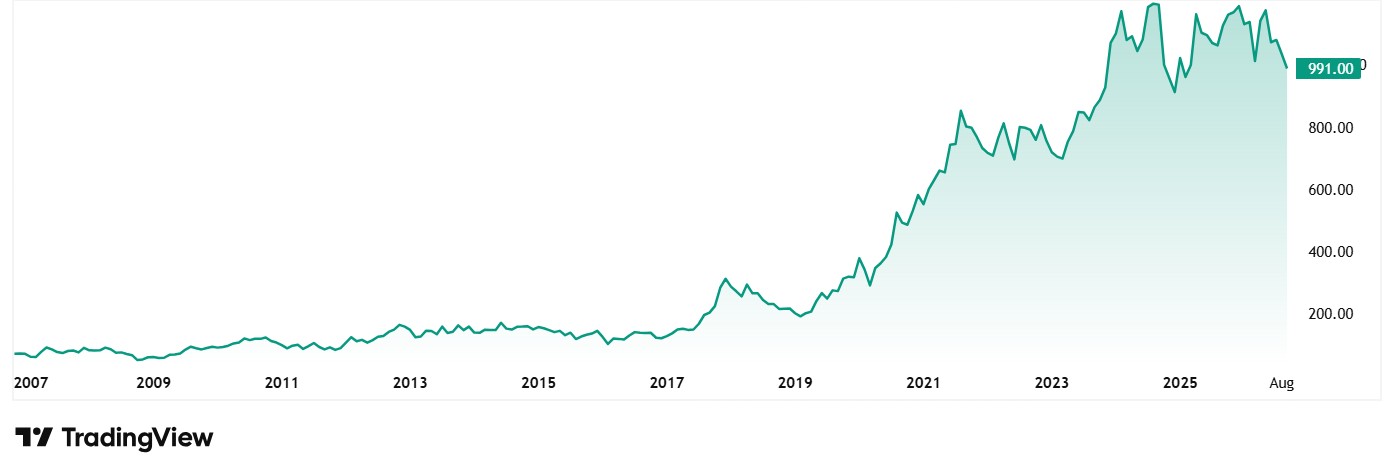
As for valuations, the company’s share is trading at a PE of 59.5x and the industry median currently is 18x. The 10-year median PE for the company is 68x while the industry median for the same period is 18x again.
Paying Rs 59.50 for every Rs 1 of current earnings, set against a 7.35% return on equity, is a premium price for a below-average return. The fall from the high has not made this stock cheap. It has made a very expensive stock slightly less expensive.
The dividend softens the picture. The board recommended Rs 10 per share for FY26 on 8th May 2026, up 21% from Rs 8.25 the year before. That is a yield of about 1.01% on a payout ratio of 64%, so two-thirds of earnings goes back to owners while acquisitions are still funded out of cash flow. The 1.01% dividend is set against the industry median of 0.4%.
New Businesses Drive Growth: Inside the Capital Foods Acquisition
The June 2026 quarter was the best argument the bulls have. Revenue rose 12% to Rs 5,349 cr, EBITDA rose 19% to Rs 730 cr with the margin widening 80 basis points to 13.6%, and net profit rose 29% to Rs 427 cr.
The split inside that matters more. Newer businesses, which include Tata Sampann, ready-to-drink beverages, Capital Foods and Organic India, grew 47% and now make up 36% of the India business. Traditional tea revenue fell 4%. The business is turning into something other than a tea seller, which is precisely the plan.
Then on 1st September 2026, in a BSE filing, it disclosed buying a further 5% of Capital Foods from Wildflower Private Trust, taking its holding to 80%. It paid Rs 5,100 cr for the first 75% in early 2024. The mix shift is genuine, and it is being paid for in cash.
#2 Rallis India: The Cyclical Agrochemical Play
Incorporated on 23rd August 1948 and part of the Tata group since the 1960s, Rallis India makes insecticides, herbicides and fungicides, and sells hybrid seeds through its Metahelix arm, reaching roughly 80% of India’s districts. Market cap is Rs 3,928 cr, and Tata Chemicals holds 55.04%.
Here is the number that should stop a reader. In July 2023, Tata Chemicals bought 97 lakh shares of Rallis at Rs 215.05 each from Rekha Jhunjhunwala, lifting its stake by about 5 percentage points. On 11th September 2026 the stock closed at Rs 201.99. The parent paid more for this business three years ago than the open market will pay today.
Institutional Selling: The SBI Mutual Fund Impact
Part of the fall has a name attached to it. SBI Mutual Fund held 9.17% of Rallis across its schemes. A disclosure filed under the takeover code in July 2026 showed it down at 7.12%. When one institution unwinds two percentage points of a company this small, the price feels it.
Foreign holding has slid too, from 14.20% in September 2025 to 9.12% in June 2026, while public shareholding rose to 23.66%. Retail bought what the funds sold. The promoter group, steady at 55.08%, has not parted with a single share.
From Trough to Peak: Revealing Rallis’ Hidden Growth
| Financial Year | FY21 | FY22 | FY23 | FY24 | FY25 | FY26 | 5-yr CAGR |
| Sales (Rs Cr) | 2,429 | 2,604 | 2,967 | 2,648 | 2,663 | 2,897 | 4% |
| EBITDA (Rs Cr) | 325 | 281 | 221 | 313 | 288 | 362 | 2% |
| Net Profit (Rs Cr) | 229 | 164 | 92 | 148 | 125 | 184 | -4% |
EBITDA here means operating profit before other income. Those five-year numbers look poor, and read literally they are. Sales compounded at about 4%, EBITDA managed 2%, and net profit shrank by roughly 4% a year.
But the shape matters more than the slope. FY21 was a peak. FY23 was the trough, when a worldwide glut in agrochemicals wrecked prices and forced the industry to write down inventory. Measure from that bottom and the picture inverts: EBITDA compounded at about 18% a year to FY26 and net profit at about 26%.
Return on capital employed tells the same story, 8% in FY23 against 14.1% today. That is the honest way to read a cyclical business that fell over and has been getting back up.
A 1.49% Yield on a Near-Zero Debt Balance Sheet
The share price of Rallis was about Rs 290 in September 2021 and as of closing on 11th September 2026 it was Rs 202.
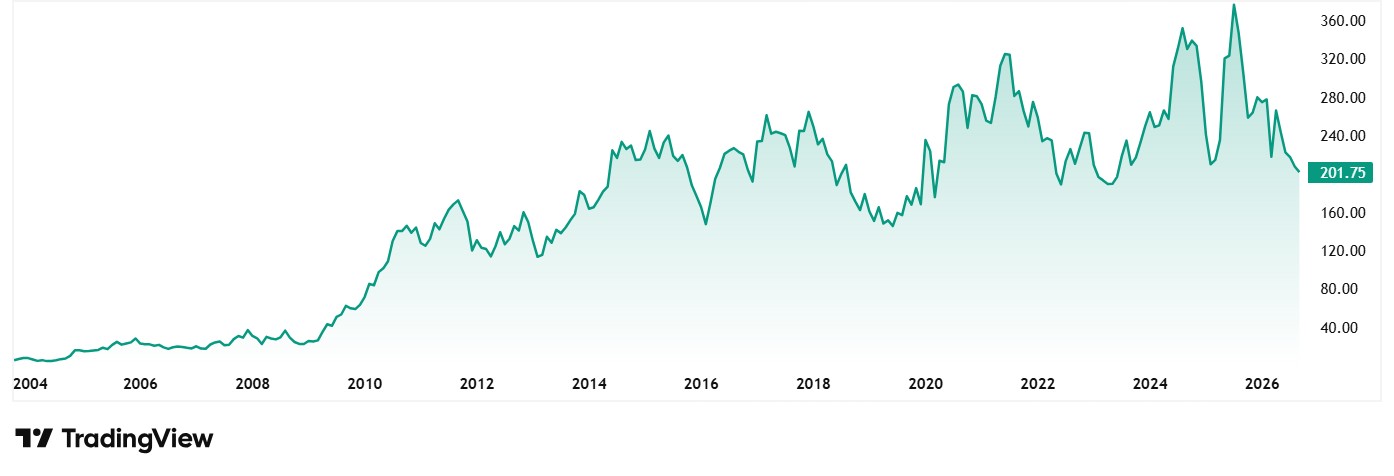
Regarding valuation, Rallis trades at a PE of 17x against the current industry median of 21x. The 10-year median PE for the company is 29x while the industry median for the same period is 25x. On a book value of Rs 105 it sits at 1.9 times book, against 4.5 times for its group sibling.
The company declared a dividend of Rs 3 per share at its annual general meeting on 24th June 2026. At Rs 202 that is a yield of about 1.49%, against a median of 0.20% across those same peers, so Rallis pays roughly seven times what a typical agrochemical company pays. Borrowings stand at Rs 61 cr against reserves of Rs 2,024 cr, a debt-to-equity ratio of 0.03.
The June 2026 quarter was its strongest in years. Revenue rose 7% to Rs 1,022 cr, a first above Rs 1,000 cr. EBITDA rose 23% to Rs 184 cr, taking the margin to 18%, and net profit rose 31% to Rs 125 cr.
Cash Flow and Seasonality: The Fine Print on Rallis
Two things deserve a careful eye. The first is cash. Operating cash flow covered only 66% of operating profit in FY26, down from 121%. Inventory days rose to 217 from 185 and free cash flow fell to Rs 143 cr from Rs 224 cr. Profit improved; the cash behind it did not keep up, and in an inventory-heavy business that gap matters.
The second is the calendar. Rallis earns nearly everything in two quarters. In the March 2026 quarter, it reported an operating loss of Rs 1 cr and a net loss of Rs 15 cr. That is seasonality, not a red flag, but one quarter read alone will mislead. Monsoon timing writes most of this company’s annual result. Finance leadership is changing too: on 20th August 2026 the company told the BSE that Bhaskar Swaminathan steps down as chief financial officer on 4th November 2026.
Distinguishing Value from a Value Trap
Tata Consumer is a good business carrying a demanding price. Earnings are growing, the balance sheet is clean and the newer categories are doing the heavy lifting. But at 59.5 times earnings on a 7.35% return on equity, the drop from Rs 1,283 to Rs 991 is not obviously a bargain appearing. Eight quarters of foreign selling suggest somebody worked that out a while ago.
Rallis is the mirror image. Smaller, more cyclical, harder to love. But it is cheaper than its peers, pays more than they do, owes almost nothing and earns more each quarter than a year ago. Its own parent paid Rs 215 a share in 2023. The market wants Rs 202 today.
Neither of those is a verdict. A cheap stock can sit cheap for years, and a dear one can grow into its price. What these September lows hand retail investors is a clean pair of case studies: one where the price fell and the value probably did not, and one where the price fell because the value was never quite there at that multiple. Which is which being the reader’s homework, not the headlines.
Adding both to a watchlist and tracking the next few quarters would be a sensible place to start.
Disclaimer
Note: We have relied on data from http://www.Screener.in and http://www.trendlyne.com throughout this article. Exchange filings referenced above are available on the BSE website. Only in cases where the data was not available, have we used an alternate, but widely used and accepted source of information.
The purpose of this article is only to share interesting charts, data points and thought-provoking opinions. It is NOT a recommendation. If you wish to consider an investment, you are strongly advised to consult your advisor. This article is strictly for educative purposes only.
Suhel Khan has been a passionate follower of the markets for over a decade. During this period, he was an integral part of a leading Equity Research organisation based in Mumbai as the Head of Sales & Marketing. Presently, he is spending most of his time dissecting the investments and strategies of the Super Investors of India.
Disclosure: The writer and his dependents do not hold the stocks discussed in this article. The website managers, its employee(s), and contributors/writers/authors of articles have or may have an outstanding buy or sell position or holding in the securities, options on securities or other related investments of issuers and/or companies discussed therein. The content of the articles and the interpretation of data are solely the personal views of the contributors/writers/authors. Investors must make their own investment decisions based on their specific objectives, resources and only after consulting such independent advisors as may be necessary.