




Made in India, Wired for America
Every bull market needs a story to fall in love with. This one has two: artificial intelligence and energy. Yet some of the biggest winners of the past year have come from the plumbing, the factories that make what data centres and pipelines run on.
I ran a stock screen for companies up at least 10% in three months, with rising net profit growth, and it did give me a long list. So, I sorted it by the size of the jump and two names sit on top. Sterlite Technologies has gone from a 52-week low of Rs 84.6 to Rs 955 as on 1st October 2026, more than 11 times in a year. Welspun Corp has run from a low of Rs 710 to a high of Rs 2,900.
The two businesses look nothing alike, but they share one thread. The market now prices both as American infrastructure plays. Sterlite earned 54% of its June quarter revenue in North America. Welspun won the largest order in its history through its US arm last week. The real question is whether profits can keep pace with prices. Let us dive in.
#1 Sterlite Technologies: From 5G Hangover to AI Data Centre Darling
Sterlite Technologies, or STL, came into being in July 2001, when the telecom division of Sterlite Industries was carved out. It makes optical fibre, strands of glass thinner than a human hair, and the cables and connectors built around them. With a market cap of Rs 49,110 cr, it holds roughly 8% of the global optical fibre cable market outside China.
For years it was a stock which investors wanted to forget. The operating margin slid from 17% in FY21 to 10% in FY25, and the company posted losses in FY24 and FY25.
Then one of the world’s largest tech firms began building AI data centres at a furious pace. Inside them, thousands of chips must talk to each other at enormous speed, and they do it over fibre.
The shift shows up in STL’s numbers. Per its June quarter earnings call, data centres made up 21% of revenue, against just 1% in FY26. North America’s share rose to 54% from 39%.
The Rs 18,618 Crore Order Book Behind the Rally
STL booked Rs 13,100 cr of fresh orders in the June 2026 quarter, about 1.7 times its wins for all of FY26. Its open order book stood at a record Rs 18,618 cr, nearly four times FY26 sales of Rs 4,745 cr.
In May, it disclosed a product award letter from a global hyperscaler worth about USD 1.11 billion, to be supplied between FY27 and FY29. Then, on 1st October 2026, a filing on the BSE revealed a long-term supply agreement with a hyperscale partner worth about USD 1.2 billion, running till December 2030.
The value is, however, an estimate based on current prices; purchase orders will come in periodically, and penalties on both sides are capped if demand or supply falls short. Nor does it say whether this deal overlaps with May’s. In plain words, it is a framework for future business, not a cheque in the bank.
| Quarter | Jun 2025 | Sep 2025 | Dec 2025 | Mar 2026 | Jun 2026 |
| Sales (Rs cr) | 1,019 | 1,034 | 1,257 | 1,441 | 1,910 |
| EBITDA (Rs cr) | 132 | 129 | 120 | 195 | 385 |
| Net Profit (Rs cr) | 10 | 4 | -17 | 59 | 197 |
Source: Screener.in (Consolidated)
EBITDA is operating profit before other income. The June quarter was the best in STL’s history. Sales jumped 87% on year, operating profit nearly tripled, the margin rose to 20% from 13%, and net profit hit Rs 197 cr against Rs 10 cr.
A Five-Year Record That Needs a Footnote
| Financial Year | FY21 | FY22 | FY23 | FY24 | FY25 | FY26 | 5Y CAGR |
| Sales (Rs cr) | 4,825 | 5,437 | 6,925 | 4,083 | 3,996 | 4,745 | NM |
| EBITDA (Rs cr) | 811 | 665 | 895 | 471 | 416 | 569 | NM |
| Net Profit (Rs cr) | 265 | 45 | 127 | -57 | -123 | 56 | NM |
Source: Screener.in (Consolidated)
EBITDA is operating profit before other income. NM: not meaningful. I have marked the five-year growth rates as not meaningful. STL spun off its services business into a separately listed company, STL Networks, with effect from 1st April 2023. The FY21 to FY23 numbers include that business; later years do not. Comparing them would compare two different companies. What is clear is that the recovery only began in FY26.
Valuation: Paying 208 Times Trailing Earnings
The share price of Sterlite Technologies was around Rs 122 in October 2025 and as of closing on 1st October 2026 it was Rs 955, a jump of almost 690% in one year.
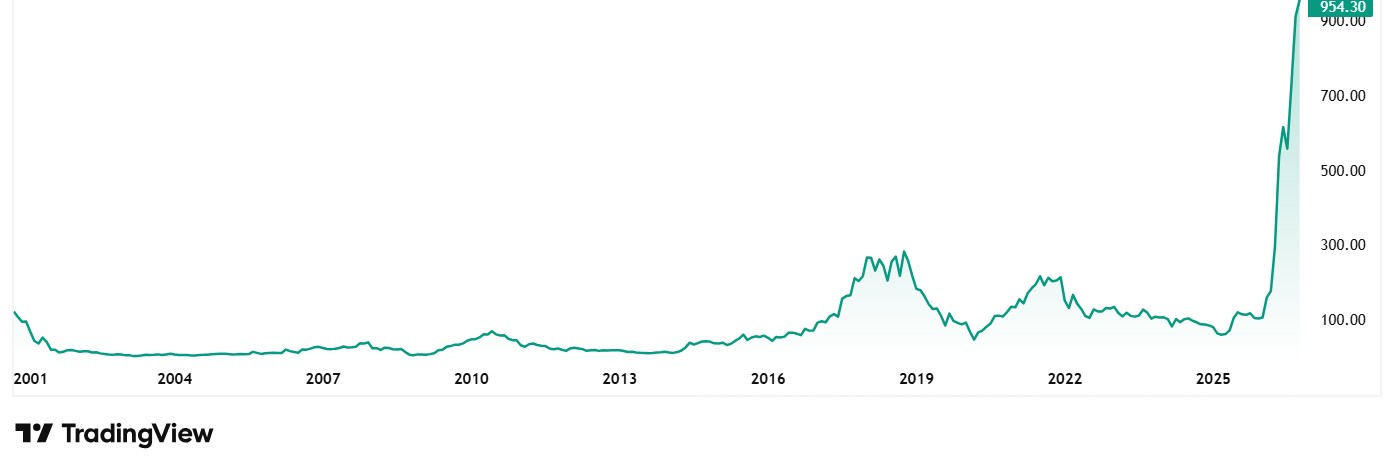
The company’s stock is currently trading at a PE of 208x compared to the current industry median of 59x. The 10-year median PE for the company is 23x while the industry median for the same period is 24x. It also trades at about 20 times its book value, while return on equity over the last three years has averaged a negative 3%.
Even if one generously multiplies the record June quarter profit by four, the stock still trades at over 60 times earnings. The market is paying today for profits STL has not yet earned.
Beyond the Hype: Examining the Fundamental Risks
The risks deserve equal space. The stock sits in Stage IV of the exchanges’ long-term surveillance framework, so buyers must pay the full amount upfront, and the price can move only 5% a day. In July, STL raised Rs 1,500 cr by issuing 2.57 cr new shares to institutions.
Promoters sold nothing, but their stake slipped from 44.51% to 42.29% as a result. Foreign investors have piled in, from 11.47% in March 2026 to 19.71%. And future revenue now leans heavily on a few giant customers whose AI budgets can change fast.
#2 Welspun Corp: The Pipe Maker with a Rs 45,000 Crore Order Book
Incorporated in 1995 as Welspun Gujarat Stahl Rohren, Welspun Corp is one of the world’s largest makers of large diameter steel pipes, the kind that carry oil, gas and water across hundreds of kilometres. Valued at Rs 68,739 cr, it runs plants in India, the US and Saudi Arabia and sells in more than 50 countries. It also owns Sintex, the water tank brand.
On 25th September 2026, Welspun told the BSE that its US subsidiary, Welspun Tubular LLC, had won an order worth about USD 412.5 million, roughly over Rs 3,600 cr. It is the largest order in the company’s history by volume, length and value. The pipes will be made at its upgraded Little Rock mill in the US and supplied during FY28 and FY29.
With that win, the global order book stands at a record USD 4.7 billion, around Rs 39,500 cr. In January 2026, the company had reported an order book of Rs 23,460 cr. It has nearly doubled in nine months, and now equals about 2.7 times FY26 sales.
Unpacking the “Spectacular” Quarter: The Impact of One-Off Gains
The June 2026 quarter looked spectacular. Net profit came in at Rs 1,048 cr, up 200% from Rs 349 cr. But Rs 548 cr of that was a one-time gain from selling part of its stake in EPIC, its Saudi associate. Strip that out and, by the company’s own count, underlying profit was Rs 499 cr, still up about 42%.
The operating story is genuinely better. Sales rose 15% to Rs 4,081 cr and operating profit grew 32% to Rs 692 cr. The 17% margin is the best in at least 13 quarters, and the company reported net cash of Rs 2,336 cr in June.
| Financial Year | FY21 | FY22 | FY23 | FY24 | FY25 | FY26 | 5Y CAGR |
| Sales (Rs cr) | 7,153 | 6,505 | 9,758 | 17,340 | 13,978 | 16,770 | 19% |
| EBITDA (Rs cr) | 795 | 473 | 494 | 1,561 | 1,684 | 2,236 | 23% |
| Net Profit (Rs cr) | 827 | 444 | 199 | 1,136 | 1,902 | 1,620 | 14% |
Source: Screener.in (Consolidated)
EBITDA is operating profit before other income. Two things stand out. The operating margin has climbed from 5% in FY23 to 13% in FY26, which is why EBITDA grew faster than sales. And FY26 profit actually fell 15%, because FY25 was inflated by other income of Rs 1,248 cr, over half its pre-tax profit. Return on capital employed is a solid 23%, and operating cash flow hit a record Rs 3,204 cr in FY26.
Valuation: Cheaper Than STL, Dearer Than Its Own Past
The share price of Welspun Corp was around Rs 854 in October 2025 and as of closing on 1st October 2026 it was Rs 2,606, a jump of around 205% in one year. Over five years, the stock has compounded at about 79% a year.
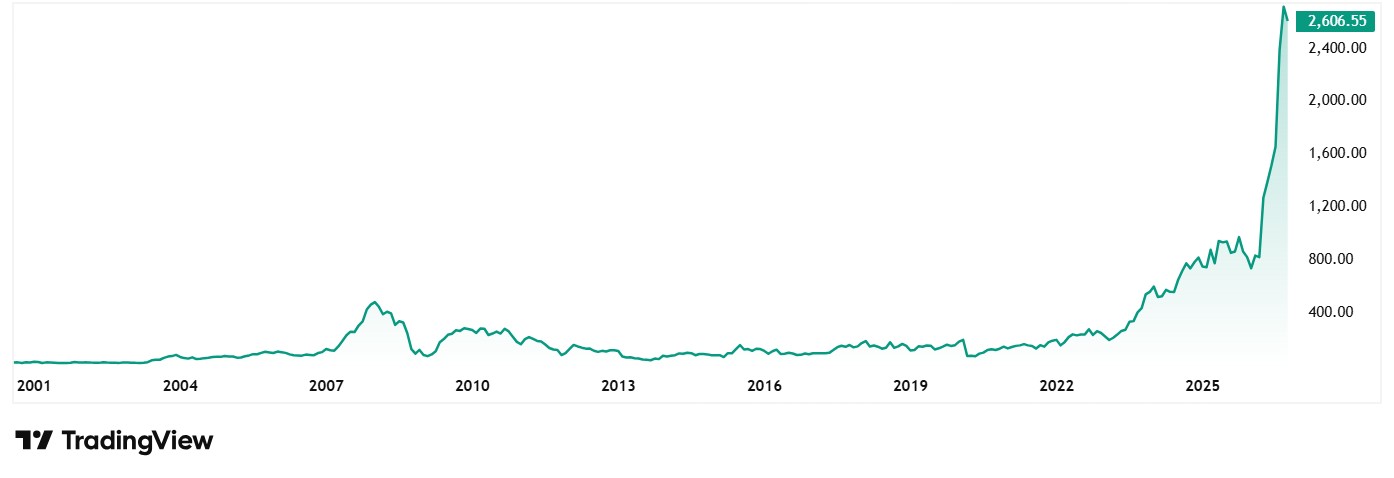
The company’s stock is currently trading at a PE of 30x compared to the current industry median of 21x. The 10-year median PE for the company is 18x while the industry median for the same period is 19x. Take out the EPIC gain and trailing profit drops to about Rs 1,771 cr, which puts the real multiple closer to 39x. The stock also trades at 7.5 times book value and offers a dividend yield of just 0.19%.
Foreign investors raised their holding from 11.23% to 14.61% in the June 2026 quarter, while promoters hold a steady 49.73%. The risks are mostly about lumpiness. Pipe orders hinge on big projects that can be delayed, and the record new order only starts flowing into revenue in FY28. Borrowings also doubled to Rs 2,355 cr in FY26 as capital spending picked up.
Two Massive Re-Ratings, One Critical Difference
Both companies ride the same wave of American spending, but at very different points. Welspun has the earnings, the cash flow and a record order book behind its rally. Its catch is that headline profit flatters and the stock is no longer cheap.
STL has the more exciting story and the steeper climb. Its order book is real and growing, yet much of it rests on flexible agreements with a few large buyers. At 208 times trailing earnings, the price leaves little room for a slip.
The next test is close. Both shut their trading windows on 1st October ahead of September quarter results, which will show whether orders are turning into profit as fast as the market expects. A smart way to stay in the know would be to add these stocks to a watchlist and keep a close eye on them.
Disclaimer
Note: We have relied on data from www.Screener.in and www.trendlyne.com throughout this article. Only in cases where the data was not available, have we used an alternate, but widely used and accepted source of information, including filings made available on the BSE website.
The purpose of this article is only to share interesting charts, data points and thought-provoking opinions. It is NOT a recommendation. If you wish to consider an investment, you are strongly advised to consult your advisor. This article is strictly for educative purposes only.
Suhel Khan has been a passionate follower of the markets for over a decade. During this period, He was an integral part of a leading Equity Research organisation based in Mumbai as the Head of Sales & Marketing. Presently, he is spending most of his time dissecting the investments and strategies of the Super Investors of India.
Disclosure: The writer and his dependents do not hold the stocks discussed in this article.
The website managers, its employee(s), and contributors/writers/authors of articles have or may have an outstanding buy or sell position or holding in the securities, options on securities or other related investments of issuers and/or companies discussed therein. The content of the articles and the interpretation of data are solely the personal views of the contributors/ writers/authors.