



Conventional wisdom says higher interest rates are bad news for gold. Four decades of Fed rate-hike cycles suggest that wisdom doesn’t always hold. History shows gold has typically outperformed following the first rate hike of a Fed tightening cycle, and the current cycle, if it is one, may be no exception.
The US Fed seems to have begun an interest rate hike cycle. At least, that’s the general opinion. But hold on, you might be jumping the gun if you think this will hurt gold prices.
Is This Really a Hike Cycle?
First, let’s check if the September FOMC rate increase actually points to a hike cycle. Typically, a rate-hike cycle means three or more consecutive hikes with no intervening cuts.
On September 16, Kevin Warsh announced a 25 bps rate hike. The accompanying dot plot projected at least one more hike in 2026, another in 2027, before the rate cut campaign begins.
A World Gold Council analysis of previous tightening cycles showed that the Fed has tended not to tighten monetary policy as aggressively as members of the committee had initially expected. So, whether this is the beginning of a rate hike cycle can only be known in hindsight.
Today, the question on investors’ minds is whether the US Fed’s monetary policy is about to shift from neutral, meaning steady rates, to tightening, meaning higher rates. Will this be negative for gold?
But before we look at how gold has performed during past periods of Fed rate hikes and cuts, here’s an important caveat. The gold market is complex, and no single factor determines its price movement. Interest rates may be one influence on its price, but factors beyond the Federal Reserve’s rate policy also significantly influence price changes.
What Four Decades of Data Show
Here’s what history shows, which could be a surprise for many investors. The chart below shows that gold has historically underperformed in the months leading up to a Fed tightening cycle, only to significantly outperform in the months following the first rate hike.
Median return of gold over the past four Fed tightening cycles*
| Period | Gold median return |
| -1y | 1.00% |
| -6m | -7.00% |
| +6m | 11.50% |
| +1y | 7.50% |
Source: World Gold Council
*A WGC study based on the past four tightening cycles starting in February 1994, June 1999, June 2004, and December 2015.
How to read the table: Gold tends to weaken heading into a rate hike event (flat the year before, and a sharp sell-off in the 6 months right before) but then recover and outperform in the months after (+6m, +1y both positive).
US Fed data backs up how sharp some of these cycles were. According to the Federal Reserve Bank of St. Louis (FRED), the 1994 cycle began on February 4 that year, when the federal funds rate stood near 3%, and ended in February 1995 with the rate close to 6%, one of the fastest tightening moves in the Fed’s modern history.
The 2004 cycle followed a similar pattern, starting near 1% in June that year and reaching 5.25% by mid-2006, according to Federal Reserve data.
And, how did gold react to those rate hikes? In the 1994 cycle, running from February 1994 to February 1995, gold underperformed. But the 2004 cycle told a different story. The Fed hiked rates 17 times for a combined 425 basis points, taking the federal funds rate to 5.25%, yet gold rose roughly 49% over that same span.
Going back a few more decades shows a similar trend. Between 1971 and mid-1974, and again between 1976 and 1980, the US Fed increased rates as inflation was running hot. During this time, gold actually moved up significantly due to its perceived status as a hedge against inflation.
However, that was not always the case. The 2013 ‘Taper Tantrum’ episode saw gold falling from about $1,700 to less than $1,200 as investors priced in impending rate increases after the Fed only hinted that it would begin to reduce its monetary stimulus.
How 2022 Broke the Rule
Cut to recent times, the ‘rate hike leads to a fall in gold’ rule saw a big reversal in 2022. Data from the U.S. Federal Reserve shows how aggressive the tightening cycle was during 2022. The Fed funds rate stood near 0% in early 2022, and by mid-2023 it had climbed above 5%.
But inflation was moving up at the same time. CPI peaked at 9.1% in June 2022, and started cooling from 2024. Here’s the math: If you earned 5% on safe government bonds while inflation ran at 6% or even 4%, your real return was either negative or barely positive.
Meanwhile, the US Fed was at its job. To combat inflation, the Fed kept raising rates from March 2022 until July 2023. After that, it held rates steady until September 2024, without any cuts.
But markets knew a wave of rate cuts was coming, making gold more appealing than the dollar. In anticipation, gold started rising earlier, in February 2024.
This shows there are smart investors out there, ready to catch a trend as it emerges. Gold is not a preferred asset in a higher or rising rate environment, but as rates fall, it becomes attractive relative to the dollar.
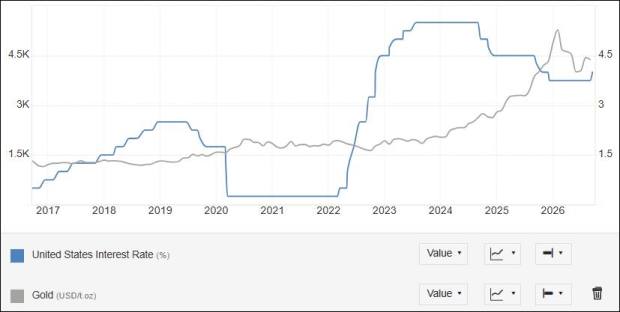
What emerged is that despite rising real yields, gold held firm, then moved higher, gaining roughly 13% in 2023, around 25% in 2024, and 65% in 2025, with demand holding strong into early 2026, till the Iran war broke out.
The chart below shows how the US Fed rate cycle starting February 2022 initially saw a dip in gold prices but soon started to rise to peak in January 2026.
Source: TradingEconomics (September 18)
But there were other reasons too. Central bank demand for gold saw a big push, with banks purchasing over 1,000 tonnes of gold annually for the next three years, a pace unlike anything seen in the past. That was also when the geopolitical environment was heating, with Russia’s invasion of Ukraine in 2022, the growing conflict between China and Taiwan, and the Israel-Hamas war.
Where Gold Stands Today
On September 16, the US Fed raised the fed funds rate by 25 basis points to 3.75%-4%, its first rate increase since July 2023. The ‘dot plot’ projected more hikes in the months ahead. As a result, the gold price dipped, but the next day it recovered the lost ground to trade close to $4,400 per ounce.
Gold prices in the Indian markets are also showing strength post the September rate hike. On MCX India, spot gold is Rs 1,53,200 per ten grams, as against Rs 1,51,940 on September 16.
One reason gold found support despite the potential rate-hike cycle was that falling oil prices provided the necessary cushion. However, the US dollar regains strength when yields are high, which further puts pressure on gold.
Bottomline
US Treasury yields remain elevated, refusing to trend lower despite Treasury Secretary Bessent’s buy-back of securities plan. However, beyond the inflationary pressure arising from elevated oil prices, US fiscal concerns are also weighing heavily on investors’ minds, supporting gold prices.
With inflationary pressure still in the background, and a potential rate hike cycle capping the medium-term outlook, amidst growing economic uncertainty, what new trigger could make or break gold from here on remains to be seen.
Disclaimer: This article is intended for informational purposes only and should not be construed as investment advice, financial guidance, or a recommendation to buy or sell any asset. Gold prices are subject to market volatility and may rise or fall without notice. Past performance is not indicative of future returns. Figures, rates, and projections are subject to revision, and readers should verify current data before making financial or investment decisions. Readers are advised to exercise due diligence and consult a qualified financial advisor before making any investment decisions.