


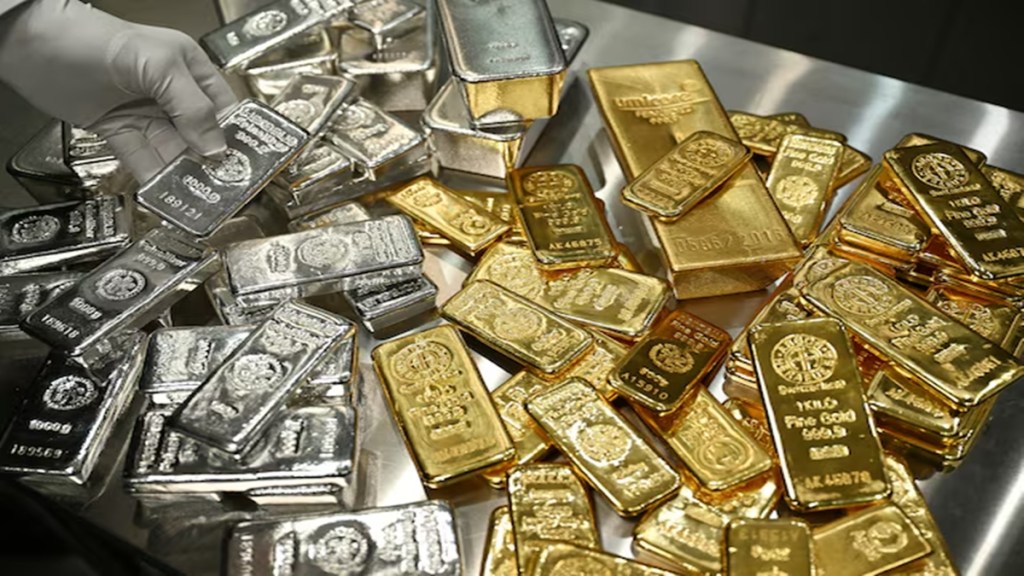

Gold and silver prices in the Indian market have rebounded significantly. On MCX, gold price in India trades 2.75% higher at Rs 1,40,802 per 10 grams. That is up by Rs 3,768 from the previous close of Rs 1,37,034.
Silver price in India is also up significantly on Wednesday. On MCX, spot silver trades at Rs 1,85,005, up by 5% over the previous day’s price of Rs 1,76,148. That means silver is rising faster than gold.
What is behind the jump? In the international market, gold prices climbed nearly 3% to reclaim the $4,000 an ounce level on Wednesday, to trade around $4,050. A weaker US dollar and falling Treasury yields supported the move. The US midterm election results pushed the dollar index lower. Silver trades at $52 an ounce, up nearly 4.5%.
Sentiment in the precious metals market turned positive after Democrats secured key victories in the US midterm elections. Markets are interpreting the results as potentially increasing the likelihood of political gridlock in Washington and limiting prospects for further fiscal expansion.
The dollar index has fallen to a four-week low of 101.5. Treasury yields declined across the curve. That boosted the appeal of non-yielding bullion.
However, uncertainty still surrounds the US-Iran stalemate. Negotiations continue to cloud the geopolitical outlook, with Washington and Tehran still far from reaching a deal to end their conflict.
Gold and silver prices: India and international markets
| Particulars | Gold | Silver |
| MCX previous close | Rs 1,37,034/10g | Rs 1,76,148/kg |
| MCX current price | Rs 1,40,802/10g | Rs 1,85,005/kg |
| MCX absolute gain | Rs 3,768 | Rs 8,857 |
| MCX percentage gain | 2.75% | 5.00% |
| International price | $4,050/ounce | $52/ounce |
| International price movement | Nearly 3% up | Nearly 4.5% up |
| Key level | Reclaims $4,000 | Trades around $52 |
Source: MCX India and Trading Economics
Central banks and ETFs have backed gold near $4,000
Data released by the World Gold Council shows how gold managed to get support around the $4,000 levels over the last three months. Central banks continued to stay bullish on gold in the previous quarter.
As per the World Gold Council’s Gold Demand Trends report for Q3 2026 (July to September), central banks bought 321 tonnes in Q3, up 42% y/y. That is a big jump. It is well above the five-year quarterly average of 227 tonnes. Only 120 tonnes of this was reported. Unreported activity made up around 63% of the quarter’s demand.
The LBMA gold price averaged $4,262 per ounce in Q3 2026. Yet total gold demand was just 1% lower at 1,369 tonnes.
Besides central banks, the other big demand came from global ETFs. Global gold ETFs added 211 tonnes and hit a record 4,256 tonnes in holdings. Quarterly inflows were a record $31 billion.
Year-to-date total demand for gold is 3,881 tonnes, almost level with the 2025 record of 3,884 tonnes. In value, it set a record of $566 billion.
Who is behind the 321-tonne jump?
Central bank demand in Q3 was 321 tonnes. A year ago it was 226 tonnes. Year-to-date purchases now stand at 675 tonnes, 6% above the same period of 2025. That comes after a subdued start to the year.
The stronger buying in Q2 and Q3 coincided with an easing in the quarterly average gold price from its Q1 high. Price volatility was lower too. Prices still remained historically elevated. The report says long-term strategic reasons, such as diversification and risk management, remain the primary driver.
China and Poland together added 104 tonnes, roughly 86% of the reported total. The People’s Bank of China was the largest buyer at 63 tonnes. The National Bank of Poland added 40 tonnes.
The two moved at different speeds. China’s Q3 buying accelerated and made up more than half of its year-to-date purchases. Poland’s slowed after a strong 51 tonnes in Q2. Kazakhstan and Uzbekistan added 14 tonnes each.
On the selling side, Russia’s 19-tonne decline was the only sizeable reduction. Turkey and Russia have combined net sales of around 140 tonnes so far this year.
India: weaker buying at home and a freeze on gold FoFs
Indian physical demand slowed sharply in the previous quarter. According to the Gem & Jewellery Export Promotion Council, India’s gold demand declined 29% year-on-year to 162.5 tonnes in the July-September quarter of 2026, compared with 229.8 tonnes in the corresponding period last year. Elevated gold prices continued to weigh on consumer purchases.
WGC reports that jewellery consumption fell 20% y/y to 100 tonnes, the weakest Q3 since 2020, although it recovered 33% q/q on festive buying. Bar and coin demand dropped 40% y/y to 55 tonnes. The festival calendar played a part, as key festivals that fell in Q3 last year come in Q4 this year.
The ETF angle is worth watching too. Indian funds added 6 tonnes in Q3. Then, in mid-October, mutual funds suspended fresh subscriptions into gold fund of funds (FoFs). The move was likely aimed at curbing gold imports. Direct investment in gold ETFs and existing systematic investment plans is unaffected. But FoFs hold around a third of Indian gold ETF assets, so new inflows could slow.
What does the World Gold Council expect in Q4?
Central banks are expected to at least match 2025 for the full year. The report raised its expectation after the stronger Q3. Investment is still seen as the main driver of demand growth, finishing 2026 around 200 tonnes above 2025. The earlier forecast was 400 tonnes.
Q4 will hinge on competing forces. Higher policy rates, bond yields and a stronger dollar could weigh on gold. Fiscal concerns, inflation risks, geopolitics and market stress may support it. Rate futures show major central banks expected to hike in Q4. Long-run inflation expectations are at a 19-year high. The pressure on gold and silver prices appears far from over.
Disclaimer: This article is for informational purposes only and does not constitute investment advice. Gold prices are volatile, and past performance is not an indicator of future returns. The data is based on reports from the World Gold Council, the Gem & Jewellery Export Promotion Council, and may change. Readers should consult a qualified financial advisor before making any investment decision. The publication does not guarantee the accuracy or completeness of the information and is not responsible for any action taken on its basis.