



Gold and silver walked into 2026 carrying big expectations from investors. In 2025, both metals had a stellar performance, touching their peak prices by the end of January. Since then, momentum has cooled, and both metals are facing fresh headwinds.
Gold is currently trading at $4,400 an ounce, while silver is at $66. That puts the two metals’ price relationship in focus. This works out to a gold-silver ratio of 66, which stays within the historical range of 60 to 70.
Interestingly, the ratio has been maintained over the last six months, except in May when it dipped below 55. Silver has fallen more than gold in the last 6 months.
In the Indian market, gold is priced at Rs 1,54,494 and silver at Rs 2,35,827 on the MCX spot market.
What Is the Gold-Silver Ratio?
In simple terms, the gold-silver ratio tells you how many ounces of silver it takes to buy one ounce of gold. So if the ratio is 66, you would need 66 ounces of silver to buy one ounce of gold. A higher ratio means gold is expensive relative to silver, and a lower ratio means the gap has narrowed.
If the ratio were to hit 100, you would need 100 ounces of silver for one ounce of gold. That could happen two ways: gold could jump to $6,600 while silver stays flat, or silver could fall to $44 while gold stays where it is.
Historically, whenever the ratio has moved toward 100, gold prices rise first, and silver tends to catch up later.
Gold-silver Ratio Chart: 5 Years
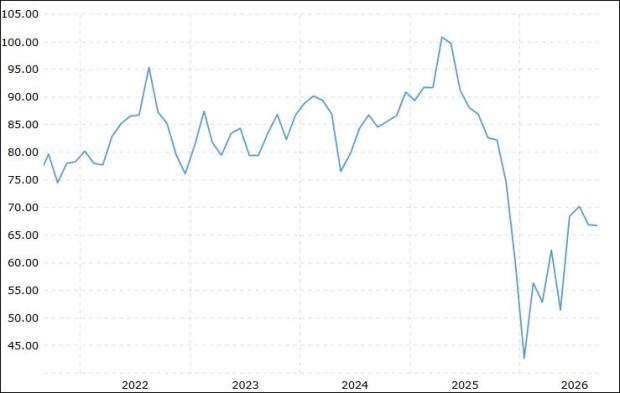
Source: Macrotrends.net As of September 4, 2026
Why the Ratio Still Sits Inside Its Historical Band
In May 2025, the ratio crossed 100, driven by a sharp rally in gold. By January 2026, the gold-to-silver ratio decreased to 49, reflecting silver’s outperformance over gold during that time. A study by DSP Mutual Fund shows that whenever precious metals rally, silver tends to significantly outperform gold.
Gold and silver outperformed other asset classes due to a weaker dollar, stagflation concerns, fiscal expansion, and geopolitical uncertainty. On the demand side, central banks, who have been the biggest force behind gold’s rise since 2022, are still buying steadily. That might explain why these two metals trade within the long-term average ratio.
Iran, Oil and the Fed: The Short-Term Headwinds
Since the start of the Iran war, the gold-silver landscape has significantly changed. The Iran war has pushed oil prices higher, which is in turn lifting US CPI and PPI inflation, making a 2026 rate cut look less likely.
This combination of elevated oil prices and fading hopes of a US-Iran deal is putting short-term pressure on both gold and silver, since delayed rate cuts raise the cost of holding assets that don’t pay any yield.
With Iran-driven inflation building on the back of rising oil prices, expectations of a rate hike have picked up. But recent comments from Fed officials have eased those expectations somewhat. Next week’s US CPI data is likely to be the real test.
However, Friday’s Nonfarm payrolls increased by 162,000 jobs, significantly surpassing the anticipated 50,000, supporting FOMC members’ claims that the labor market is operating at full employment. The report prompted investors to ramp up bets on a Fed rate hike, with markets now pricing in over a 60% chance of a 25bps increase in the federal funds rate this month.
Rising US Treasury yields are also signalling a higher-rate environment ahead. How much the US Treasury’s planned buyback of securities, starting next week, manages to cool those yields remains to be seen.
Clarity on inflation and the direction of interest rates is still missing. Until that clears up, making a strong call on either gold or silver carries real risk.
Should You Wait or Start Buying Now?
The ratio, for now, remains within its long-term average. From here, either both metals move together in the same direction, or one reacts first, and the other follows.
At the least, a pause in the September FOMC meeting could end up supporting gold and silver prices. A hawkish tone from the US Fed chair Warsh could work just the opposite.
So far in 2026, gold is up 3.3%, while silver is down 11%.
For long-term investors, timing may matter less, since the ratio has historically reverted to its range over time.
That said, given the wide range of possible outcomes right now, some caution is warranted. Investors looking at gold or silver should watch out for sharp corrections in either metal and may want to consider building positions gradually, rather than buying into sharp rallies.
The long-term outlook stays stable, but near-term performance will hinge on how the Iran conflict plays out and what the Fed signals next. Keep an eye on the US dollar index and the US Treasury bond yields to get early signals.
Disclaimer: This article is intended for informational purposes only and should not be construed as investment advice, financial guidance, or a recommendation to buy or sell any asset. Gold prices are subject to market volatility and may rise or fall without notice. Past performance is not indicative of future returns.