















• English
  • தமிழ்
  • বাংলা
  • മലയാളം
  • ગુજરાતી
  • हिंदी
  • मराठी
  • Business

The Financial Express

  • Whatsapp Whatsapp Link
  • Facebook Facebook Link
  • Twitter Twitter Link
  • Linkedin Linkedin Link
Google News Follow
Watchlist
  • Home
  • Todays Paper
  • Business
  • Markets
  • Market Stats
  • Mutual Funds
  • Money
  • India
  • Tech
  • US News
  • Shorts
  • Stock Market
  • Defence Stocks
  • MF Screener
  • Finance Stocks
  • IT Stocks
  • Gold Rate
  • Silver Rate
  • Breakout Stocks
  • Home
  • Market
    • Stock Insights
    • Cryptocurrency
    • IPO News
    • Stock Market Quotes
    • Indices
    • Nifty 50
    • Sensex
    • Top Gainers
    • Top Losers
    • IPO Stats
  • Market Dashboard
  • Commodities
    • Gold Rate in India
    • Silver Rate in India
    • Petrol Rate in India
    • Diesel Rate in India
  • Opportunity Abroad
  • Money
    • Insurance
    • Income Tax
    • Mutual Funds News
    • MF Screener
  • Economy
  • Business
    • Brand Wagon
    • SME
    • Defence
    • Healthcare
  • Industry
    • Banking & Finance
  • India News
  • World News
  • Jobs-Career
  • Infrastructure
    • Railways
    • Aviation
    • Roadways
  • Auto
  • Life
    • Lifestyle
    • Entertainment
    • Technology
    • Travel & Tourism
    • Science
  • Sports
  • Opinion
  • Multimedia
    • Photos
    • Web Stories
  • Events
  • ePaper
  • Today’s Paper
  • About us
  • PRIVACY POLICY
  • TERMS AND CONDITIONS
  • Contact Us

  1. Business News
  2. About
  3. economy

ECONOMY

  • Click to share on Twitter (Opens in new window)
  • Click to share on Facebook (Opens in new window)
  • Click to share on WhatsApp (Opens in new window)
US employment report showing job growth alongside millions of Americans working part-time despite wanting full-time jobs
4.8 million Americans want full-time work: October jobs report reveals hidden weakness

America’s October jobs report showed stronger hiring and a 4.1% unemployment rate. However, 4.8 million people were working part-time for…

November 8, 2026 17:19 IST
UN-climate-summit-COP31
COP31: Why it matters & what’s on the agenda

COP31 focuses on bridging the gap between climate commitments and real-world actions, emphasizing affordable clean energy access, climate finance, and…

Updated: November 6, 2026 10:33 IST
Chhattisgarh
Chhattisgarh’s development push: Bastar peace, infrastructure and tourism to drive investment opportunities

Tourism, local businesses and resource-based industries are among the sectors that could benefit from the expansion of infrastructure, although the…

November 2, 2026 21:27 IST
India’s Export Diversification Surge in Africa and ASEAN Driven by Petroleum
Petrol, diesel and ATF export duties revised: What changes from October 31?

The Centre has removed the Rs 2.50-per-litre special additional excise duty on petrol exports.

Updated: October 31, 2026 15:36 IST
Industrial activity, electricity infrastructure and cargo transport representing India’s Q2 FY27 GDP growth estimate
India’s economy could grow 7.35% in Q2 FY27: What Finance Ministry model estimates

A Finance Ministry nowcasting model estimates India’s GDP growth at 7.35% in Q2 FY27, following 7.8% growth in the previous…

October 29, 2026 21:12 IST
Oil tanker and cargo ship representing crude oil and shipping cost risks to India’s inflation outlook
India’s inflation risks rise as crude oil, shipping costs threaten to push up prices

India’s inflation outlook faces fresh risks as elevated crude oil prices and shipping disruptions across West Asian routes threaten to…

October 29, 2026 18:58 IST
India industrial production, IIP growth, manufacturing growth, mining contraction, September industrial data, Ministry of Statistics, economic growth India, industrial output September, manufacturing sector India India's Index of industrial production records growth of 6.7% in September 2026 Posted On: 28 OCT 2026 4:00PM by PIB Delhi In September 2026, Index of Industrial Production recorded a 6.7 % year-on-year growth, supported by 7.6 % growth in Manufacturing sector and strong growth of 11.2 % in Electricity & Gas Supply sector. The Quick Estimate of Index of Industrial Production (IIP) is released on 28th of every month (or next working day if 28th is a holiday). The index is compiled with data received from source agencies, which in turn receive the data from the producing factories/ establishments. These Quick Estimates will undergo revision in subsequent releases as per the revision policy of IIP. 2. Key Highlights: The IIP growth rate for the month of September 2026 is 6.7 percent which was 8.0 percent (Quick Estimate) in the month of August 2026. The growth rates of the sectors, Mining & Quarrying, Manufacturing, Electricity & Gas Supply and Water Supply, Sewerage & Waste Management for the month of August 2026 are (-) 6.2 percent, 7.6 percent, 11.2 percent and 5.8 percent respectively. The Quick Estimate of IIP stands at 124.3 against 116.5 in September 2025. The indices of Industrial Production for Mining & Quarrying, Manufacturing, Electricity & Gas Supply and Water Supply, Sewerage & Waste Management for the month of September 2026 stand at 90.4, 128.0, 128.6 and 146.4 respectively. Within the Manufacturing sector, 17 out of 23 industry groups at NIC 2 digit-level have recorded a positive growth in September 2026 over September 2025. The top three positive contributors for the month of September 2026 are – “Manufacture of motor vehicles, trailers and semi-trailers” (19.0 %), “Manufacture of electrical equipment” (33.9 %), and “Manufacture of rubber and plastics products” (19.9 %). In the industry group “Manufacture of motor vehicles, trailers and semi-trailers” item groups “Auto Components, Spares and Accessories”, “Passenger Cars”, and “Commercial Vehicles” have shown significant contribution in growth. In the industry group “Manufacture of electrical equipment”, item groups “Electrical Apparatus for Switching or Protecting Electrical Circuits (e.g., Switchgear, Circuit Breakers/Switches, Control/Meter Panels) and Parts Thereof”, “UPS and Solid-State Drives” and “End-Face Connectors for Optical Fibres and Cables” have shown significant contribution in growth. In the industry group “Manufacture of rubber and plastics products”, item groups “Acrylic Sheets (Including PVC, Polystyrene/Polycarbonate and Other Plastic Sheets)”, “Tyres for Light Motor Vehicles (LMV)”, and “V-Belts and Rubber Conveyors” have shown significant contribution in growth. As per the Use-Based Classification, the indices stand at 111.6 for Primary Goods, 153.4 for Capital Goods, 131.7 for Intermediate Goods and 133.0 for Infrastructure/ Construction Goods for the month of September 2026. Further, the indices for Consumer durables and Consumer non-durables stand at 133.1 and 111.8 respectively. The corresponding growth rates of IIP as per Use-Based Classification in September 2026 over September 2025 are 4.0 percent in Primary Goods, 10.4 percent in Capital Goods, 12.2 percent in Intermediate Goods, 7.2 percent in Infrastructure/ Construction Goods, 6.0 percent in Consumer durables and 1.4 percent in Consumer non-durables (Statement III). Based on Use-Based Classification, top three positive contributors to the growth of IIP for the month of September 2026 are Intermediate Goods, Primary Goods and Capital Goods. Along with the Quick Estimate of IIP for the month of September 2026, the indices for August 2026 have undergone final revision in the light of the updated data received from the source agencies. The Quick Estimates for September 2026 and the final revision for August 2026 have been compiled at weighted response rates of 86.5 percent and 92.0 percent respectively. Details of Quick Estimates of the Index of Industrial Production for the month of September 2026 at Sector, Sub-Sector, 2-digit level of National Industrial Classification (NIC-2025), by Use-Based Classification and are given at Statements I, II (A, B, C, D) and III respectively. Also, for users to appreciate the changes in the industrial sector, Statement IV provides month-wise indices for the last 13 months, by industry groups (as per 2-digit level of NIC-2025), sectors and Sub-Sectors. Release of the IIP for October 2026 will be on Monday, 30th November 2026. Note: - This Press Release (English and Hindi Version) is also available at the Ministry’s Website -http://www.mospi.gov.in. Detailed data pertaining to IIP is available at https://esankhyiki.mospi.gov.in/macroindicators?product=iip STATEMENT I: INDEX OF INDUSTRIAL PRODUCTION – SECTORAL (Base: 2022-23=100) Months Mining & Quarrying Manufacturing Electricity & Gas Supply Water Supply, Sewerage & Waste Management General 11.053 76.062 10.865 2.020 100.00 2025-26 2026-27 2025-26 2026-27 2025-26 2026-27 2025-26 2026-27 2025-26 2026-27 Apr 110.3 106.1 111.9 118.7 116.3 121.7 137.1 146.1 112.7 118.2 May 114.7 113.1 116.2 122.2 117.9 130.1 137.6 145.1 116.7 122.5 Jun 108.9 110.6 114.4 125.3 118.4 131.8 137.3 145.7 114.7 124.8 Jul 95.3 94.4 118.7 128.4 122.8 133.5 138.2 148.4 117 125.6 Aug 90.8 86.6 116.2 126.2 119.2 133.9 138.8 147.6 114.2 123.1 Sep* 96.4 90.4 119 128 115.6 128.6 138.4 146.4 116.5 124.3 Oct 105.9 112.5 105.6 141.2 111.6 Nov 106.9 117.3 98.7 140.5 114.6 Dec 117.8 125.6 111.1 141.3 123.5 Jan 120.6 124 115 142.7 123 Feb 114.7 119.2 107 143.4 117.9 Mar 125.4 131.4 119.2 146.3 129.7 Cumulative Index Apr-Sep 102.7 100.2 116.1 124.8 118.4 129.9 137.9 146.6 115.3 123.1 Growth over the corresponding period of previous year Aug 15.8 -4.6 3.6 8.6 3.7 12.3 6.9 6.3 4.7 7.8 Sep* 15.7 -6.2 5.5 7.6 3.3 11.2 6.2 5.8 6.1 6.7 Apr-Sep 8 -2.4 4.4 7.5 0.6 9.7 7.6 6.3 4.4 6.8 *Figures for Sep 2026 are Quick Estimates. NOTE : Indices for the months of Aug'26 incorporate updated production data. STATEMENT II A: INDEX OF INDUSTRIAL PRODUCTION - (Manufacturing at NIC 2 digit) (Base: 2022-23=100) NIC 2025 Description Weights Index Cumulative Index Percentage Growth Sep'25 Sep'26* Apr-Sep Sep'26* Apr-Sep 2025-26 2026-27 2026-27 10 Manufacture of food products 5.679 97.5 105.1 98.3 103.6 7.8 5.4 11 Manufacture of beverages 1.113 92.4 128.8 126.3 142.4 39.4 12.7 12 Manufacture of tobacco products 0.774 116.1 119.1 118.8 114.9 2.6 -3.3 13 Manufacture of textiles 3.275 123.7 145.2 122.1 137.9 17.4 12.9 14 Manufacture of wearing apparel 1.970 94 89.1 98.4 92.9 -5.2 -5.6 15 Manufacture of leather and related products 0.607 98.3 102.7 103.2 105.8 4.5 2.5 16 Manufacture of wood and products of wood and cork, except furniture; manufacture of articles of straw and plaiting materials 0.239 116.6 104.3 104.9 102.2 -10.5 -2.6 17 Manufacture of paper and paper products 1.375 107.1 110.2 107 115.2 2.9 7.7 18 Printing and reproduction of recorded media 0.506 99.5 94.4 99.4 98.3 -5.1 -1.1 19 Manufacture of coke and refined petroleum products 7.721 102.1 107.9 108 108.4 5.7 0.4 20 Manufacture of chemicals and chemical products 7.813 108.8 108.2 109.2 108.0 -0.6 -1.1 21 Manufacture of basic pharmaceuticals products and pharmaceutical preparations 5.833 123.9 112.9 121.7 116.3 -8.9 -4.4 22 Manufacture of rubber and plastics products 3.384 106.8 128.1 104.9 124.3 19.9 18.5 23 Manufacture of other non-metallic mineral products 3.519 107.5 114.9 111.6 122.2 6.9 9.5 24 Manufacture of basic metals 9.198 129.4 133.4 128 132.7 3.1 3.7 25 Manufacture of fabricated metal products, except machinery and equipment 2.481 128.8 141.9 120.4 134.1 10.2 11.4 26 Manufacture of computer, electronic and optical products 2.085 163.3 175.3 140.8 158.5 7.3 12.6 27 Manufacture of electrical equipment 3.175 129 172.7 129.7 167.9 33.9 29.5 28 Manufacture of machinery and equipment n.e.c. 5.020 139.7 144.0 118.4 129.0 3.1 9.0 29 Manufacture of motor vehicles, trailers and semi-trailers 6.417 123.6 147.1 116.4 138.7 19 19.2 30 Manufacture of other transport equipment 2.089 160.5 191.2 139.3 170.0 19.1 22.0 31 Manufacture of furniture 0.283 123.4 139.2 114.5 124.3 12.8 8.6 32 Other manufacturing 1.509 135 126.4 112 114.1 -6.4 1.9 10-32 Manufacturing 76.062 119 128.0 116.1 124.8 7.6 7.5 *Figures for Sep 2026 are Quick Estimates. STATEMENT II-B: INDEX OF INDUSTRIAL PRODUCTION - (Mining & Quarrying) (Base: 2022-23=100) NIC 2025 Description Weights Index Cumulative Index Percentage growth Sep'25 Sep'26* Apr-Sep Sep'26* Apr-Sep 2025-26 2026-27 2026-27 05-06 Fuel Minerals 5.647 93.6 95.6 99.3 96.3 2.1 -3 07 Metallic Minerals incl. Rare Earth Minerals 1.995 91.2 104 100.5 119.6 14 19 08 Non-Metallic Minerals incl. Minor Mineral 3.411 104.1 73.7 109.8 95.4 -29.2 -13.1 05-08 Mining & Quarrying 11.053 96.4 90.4 102.7 100.2 -6.2 -2.4 STATEMENT II-C: INDEX OF INDUSTRIAL PRODUCTION - (Electricity & Gas Supply) (Base: 2022-23=100) NIC 2025 Description Weights Index Cumulative Index Percentage Growth Sep'25 Sep'26* Apr-Sep Sep'26* Apr-Sep 2025-26 2026-27 2026-27 3512 Electricity Generation from Renewable Sources 2.332 160.8 167.7 150.6 166.4 4.3 10.5 3511 Electricity Generation from Non-Renewable Sources 7.839 101.6 118.4 109 120.5 16.5 10.6 351 Electricity 10.171 115.2 129.7 118.5 131 12.6 10.5 352 Gas Supply 0.694 121.2 113.1 116 114.5 -6.7 -1.3 35 Electricity & Gas Supply 10.865 115.6 128.6 118.4 129.9 11.2 9.7 STATEMENT II-D: INDEX OF INDUSTRIAL PRODUCTION - Water Supply, Sewerage & Waste Management (Base: 2022-23=100) NIC 2025 Description Weights Index Cumulative Index Percentage Growth Sep'25 Sep'26* Apr-Sep Sep'26* Apr-Sep 2025-26 2026-27 2026-27 36 Water Supply 1.059 152 158.6 150.9 157.5 4.3 4.4 37-38 Sewerage & Waste Management 0.961 123.5 133 123.6 134.5 7.7 8.8 36-38 Water Supply, Sewerage & Waste Management 2.020 138.4 146.4 137.9 146.6 5.8 6.3 *Figures for Sep 2026 are Quick Estimates. STATEMENT III: INDEX OF INDUSTRIAL PRODUCTION – USE-BASED (Base :2022-23=100) Month Primary goods Capital goods Intermediate goods Infrastructure/ Consumer durables Consumer construction goods non-durables 31.136 8.082 22.416 10.908 11.312 16.148 2025-26 2026-27 2025-26 2026-27 2025-26 2026-27 2025-26 2026-27 2025-26 2026-27 2025-26 2026-27 Apr 112.8 113.7 111.4 124.8 112.1 123.7 120.7 128 111.7 118 109.2 109.4 May 116.6 119.8 119.8 138.4 116.3 123.1 123.5 131.7 112.3 121.3 114.3 113.8 Jun 113.9 120 123 145 113.6 126.7 123.6 134.5 111.2 122.6 110 116.2 Jul 111.3 116 122.1 145.3 119 131.4 127.4 137.6 117.6 131.7 114.9 114 Aug 108 112.5 120.4 139.5 115.9 132.4 124.5 134.4 116.5 128.7 112 110.8 Sep* 107.3 111.6 139 153.4 117.4 131.7 124.1 133 125.6 133.1 110.3 111.8 Oct 109.4 116.8 112.9 122.3 114.7 101.8 Nov 106.4 127 116.7 124.8 118.7 111.2 Dec 116.5 140.5 125.2 136.3 117.4 121.7 Jan 118.7 133.3 124.3 140.3 120.6 114.4 Feb 111.3 143.4 116.1 131.8 118.2 110.7 Mar 122.6 176.4 128.6 140.4 123.1 119.3 Cumulative Index Apr-Sep 111.7 115.6 122.6 141.1 115.7 128.2 124 133.2 115.8 125.9 111.8 112.7 Growth over the corresponding period of previous year Aug 7.6 4.2 6 15.9 3.3 14.2 9.2 8 0.9 10.5 0.1 -1.1 Sep* 6.6 4 13.2 10.4 6.4 12.2 9.8 7.2 4.6 6 -0.5 1.4 Apr-Sep 3.7 3.5 8.6 15.1 4.6 10.8 8.1 7.4 2.9 8.7 1.6 0.8 *Figures for Sep 2026 are Quick Estimates. NOTE : Indices for the months of Aug'26 incorporate updated production data. STATEMENT IV: MONTHLY INDEX OF INDUSTRIAL PRODUCTION (Base: 2022-23=100) NIC 2025 Description (Manufacture of) Weight Sep-25 Oct-25 Nov-25 Dec-25 Jan-26 Feb-26 Mar-26 Apr-26 May-26 Jun-26 Jul-26 Aug-26 Sep-26 10 Food products 5.679 97.5 98.5 115.7 126.2 117.9 107.9 103.5 100.5 103.3 103.6 105.5 103.8 105.1 11 Beverages 1.113 92.4 93.3 83.4 71.8 110.3 124.5 153.9 155.2 166.9 152.7 126.3 124.2 128.8 12 Tobacco products 0.774 116.1 105.3 120.7 141.2 139.8 78.4 106.2 113.8 113.7 116.8 108.1 118 119.1 13 Textiles 3.275 123.7 114.2 122 128.7 121.4 92 136.6 135.7 136.8 135.8 136.3 137.7 145.2 14 Wearing apparel 1.97 94 87.2 93 109.3 99.9 96.6 101.2 91 94.7 98.1 95.9 88.6 89.1 15 Leather and related products 0.607 98.3 90.7 99.5 108.3 103.5 100 96.4 99.8 102.1 108 113.3 108.8 102.7 16 Wood and products of wood and cork, except furniture; manufacture of articles of straw and plaiting materials 0.239 116.6 101.6 110 126.5 119.8 109.5 108.5 84.3 94.7 104.5 113.2 112 104.3 17 Paper and paper products 1.375 107.1 105.2 109.2 114.2 111.3 112 118.9 115 119.5 115.8 118.5 112.2 110.2 18 Printing and reproduction of recorded media 0.506 99.5 92.6 102.9 109.7 105.9 107 115.1 103.8 97.5 99.5 101 93.8 94.4 19 Coke and refined petroleum products 7.721 102.1 111.1 107.4 115.8 114.3 103.1 115.3 104.6 106.8 108.4 113.1 109.8 107.9 20 Chemicals and chemical products 7.813 108.8 104.9 108.3 113.4 111.7 109.9 112.2 104.9 108 108 109.5 109.2 108.2 21 Pharmaceuticals, medicinal chemical and botanical products 5.833 123.9 106.4 115.2 133.1 114.6 118.2 132 110.7 115.3 123.7 120 115 112.9 22 Rubber and plastics products 3.384 106.8 98.3 103.8 108.1 108.5 105.4 109.5 125.8 111.4 124.1 129.1 127.2 128.1 23 Other non-metallic mineral products 3.519 107.5 109 111.9 128.2 126.9 122.1 130 115.8 122.3 130.6 132.5 117.2 114.9 24 Basic metals 9.198 129.4 129.3 129.4 139.3 143.3 130.3 141.5 128.9 131.8 129.8 134.6 137.7 133.4 25 Fabricated metal products, except machinery and equipment 2.481 128.8 115.2 124.9 137.8 137.7 135.8 153.4 125.9 128.4 135.1 137.9 135.2 141.9 26 Computer, electronic and optical products 2.085 163.3 127.6 132.9 139.1 140 140.7 151.2 137.9 160 154.2 156.8 166.8 175.3 27 Electrical equipment 3.175 129 125.2 130.6 149.9 147.2 153.7 175 151.5 162.5 179.4 170.9 170.3 172.7 28 Machinery and equipment n.e.c. 5.02 139.7 109.6 116.8 129.3 121.6 130.2 167.2 109.9 125.9 135.7 131.4 126.9 144 29 Motor vehicles, trailers and semi-trailers 6.417 123.6 122.4 128.7 125.1 135.3 135.8 143.9 130.4 132.9 128.4 149.4 143.9 147.1 30 Other transport equipment 2.089 160.5 144.7 150.6 141.6 149.2 147.4 153.1 153.4 146.8 162.5 184.8 181.1 191.2 31 Furniture 0.283 123.4 117.3 115.2 125 119.9 121.2 131.1 109.8 116.3 123.8 131.8 124.9 139.2 32 Other manufacturing 1.509 135 111.8 107.2 105.7 103.4 103.1 110.3 112.1 100.7 106.8 117.2 121.1 126.4 Manufacturing 76.062 119 112.5 117.3 125.6 124 119.2 131.4 118.7 122.2 125.3 128.4 126.2 128 Fuel Minerals 5.647 93.6 99.9 104.9 110.3 113.1 103.4 115.8 95.9 99.2 98.4 94.5 93.9 95.6 Metallic Minerals 1.995 91.2 112.5 129.6 142.4 142.3 134.3 156.6 130.8 143.1 141.9 102.3 95.2 104 Non-Metallic Minerals 3.411 104.1 112.1 96.8 115.7 120.4 122 123.2 108.5 118.5 112.4 89.6 69.4 73.7 Mining 11.053 96.4 105.9 106.9 117.8 120.6 114.7 125.4 106.1 113.1 110.6 94.4 86.6 90.4 Renewable 2.332 160.8 125.2 99.1 103.5 109.3 106.2 117.7 129.7 153.8 164.5 186.1 196.7 167.7 Non-Renewable 7.839 101.6 98.2 97.5 112.7 116.1 107.4 120 120.9 124.4 122.7 119.6 116.9 118.4 Electricity 10.171 115.2 104.4 97.9 110.6 114.5 107.1 119.5 122.9 131.1 132.3 134.8 135.2 129.7 Gas 0.694 121.2 123.2 110.6 118.9 121.6 105.7 114.6 104.3 115.2 125 115.2 114.2 113.1 Electricity & Gas 10.865 115.6 105.6 98.7 111.1 115 107 119.2 121.7 130.1 131.8 133.5 133.9 128.6 Water Supply 1.059 152 152.7 153 153.4 154.4 154.7 155.5 156.2 156.6 157.4 157.8 158.4 158.6 Sewerage & Waste Management 0.961 123.5 128.6 126.8 127.9 129.8 130.9 136.2 134.9 132.4 132.9 138.1 135.6 133 Water Supply, Sewerage & Waste Management 2.020 138.4 141.2 140.5 141.3 142.7 143.4 146.3 146.1 145.1 145.7 148.4 147.6 146.4 General 100.000 116.5 111.6 114.6 123.5 123 117.9 129.7 118.2 122.5 124.8 125.6 123.1 124.3
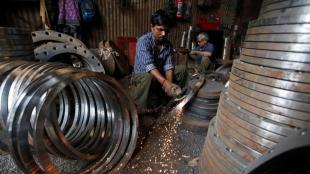
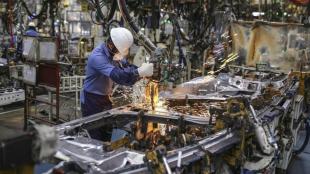
Industrial growth slows to 6.7% in September as manufacturing eases, mining contracts

India’s industrial production rose 6.7% in September, slower than August’s revised 7.8%, as manufacturing growth eased and mining declined more…

Updated: October 28, 2026 17:06 IST
India organised-sector employment growth and corporate hiring slowdown in FY26
Financials to IT: Why India Inc added only 1.8% employees in FY26 despite 9.4% wage hikes 

India’s organised-sector employment growth slowed to a five-year low in FY26, with financial services and IT hiring under pressure. Jefferies…

October 23, 2026 16:04 IST
India’s business activity picks up in October, hiring remains subdued. Services and manufacturing output expanded
October PMI rises to 56.7; Input cost inflation eased, manufacturing strong

India’s October PMI rose to 56.7 as output and orders strengthened, input costs eased and hiring slowed to 2026’s weakest…

Updated: October 23, 2026 14:58 IST
China’s economic growth, with industrial manufacturing, export activity and continued weakness in domestic demand.
China’s economy grew 4.5% in Q3: What drove growth and what remains a concern

China’s economy grew 4.5% year on year in the July-September quarter of 2026, beating forecasts as exports and advanced manufacturing…

October 19, 2026 19:00 IST
Rupee Recovery May Be Short-Lived as Global Pressures Persist
Why US bond yields & crude continue to pressurize rupee despite RBI’s mega push

RBI steps may slow the rupee’s slide, but high crude, US yields and weak inflows keep pressure on. Read what…

Updated: October 13, 2026 17:44 IST
India-older-population
Explainer: The consequences of India going grey so fast

India is aging faster than expected, with 14% of its population projected to be over 65 by 2049, challenging its…

Updated: October 2, 2026 08:19 IST
India’s weak monsoon raises rural demand, inflation concerns.
India monsoon ends with 12.5% deficit: What it means for inflation, rural demand

India’s monsoon ended 12.5% below normal, with food stocks easing inflation risks but drought and El Nino threatening rural demand;…

October 1, 2026 16:44 IST
Odisha
Odisha clears 19 projects as biofuel, textiles and tourism drive Rs 3,280 cr investment

The state-run oil company proposed establishing compressed biogas (CBG) manufacturing facilities across eight districts with an investment of Rs 960…

September 30, 2026 22:01 IST
RBI October policy: Rising inflation, crude prices raise rate-hike bets
RBI MPC October meeting: Will $107 brent & 4.82% inflation result in 25 bps rate hike? 

RBI MPC meets Oct 5-7 as inflation hits 4.82% and Brent tops $107; see if Nomura’s 25 bps hike call…

Updated: September 28, 2026 18:35 IST
India industrial output, manufacturing growth, electricity supply, gas supply, mining contraction, IIP 2025, industrial production August, Ministry of Statistics, government data, economic growth
Industrial production up by 8% in August as manufacturing strengthens

India’s industrial output rose 8% year-on-year in August 2025, boosted by manufacturing and electricity supply, as per government data using…

Updated: September 28, 2026 19:20 IST
India’s global economic role expands as markets and influence deepen: Thakur

Speaking at the SBI Conclave, Economic Affairs Secretary Anuradha Thakur outlined how India’s path to global leadership relies on robust…

September 25, 2026 01:11 IST
High US yields, crude prices pose risks to India’s economy: Motilal Oswal
RBI may raise rates by 75-100 bps if US yield and crude prices stay high: Motilal Oswal 

RBI may lift rates 75-100 bps if crude and US yields stay high, keeping bond yields elevated; read how sectors…

September 24, 2026 16:41 IST
  • Next »

Related News

Regional jewellery chains have grown faster than Titan Company, and also trade at a discount of 30% to 69% to the industry leader.
Beyond Titan: 3 jewellery stocks with lower P/Es and faster sales growth

Pension commutation rules changed? Govt issues 2 key clarifications for pensioners
Pension commutation rules changed? Govt issues key clarifications for pensioners

India's semiconductor ecosystem is gradually expanding, supported by rising demand from AI, electric vehicles, data centres and other technology-driven industries.
3 Indian Companies with Semiconductor Exposure and Large Order Books

The three companies have different return profiles as they operate in different business segments.
India’s new Rs 14,500 cr energy storage push: 3 heavyweight stocks with big expansion plans

TV Narendran and Noel Tata
TV Narendran to succeed Noel Tata as Tata International chairman
shorts
‘Cancer, Alzheimer’s will be relics of the past’: Anthropic CEO’s 10-year AI prediction
World News

Cancer, Alzheimer’s, heart disease and mental illness could become problems of the past in less than 10 years, according to Anthropic CEO Dario Amodei. He believes artificial intelligence (AI) could help scientists make medical discoveries that have remained out of reach for generations.

View all shorts

Trending Topics

defence stocks
Gold rate today
Silver rate today
AI stocks
mutual funds
semiconductor stocks

Top Categories
  • Market
  • India News
  • Stock Insights
  • Money
  • Opportunities Abroad
  • World News
  • Latest News
  • Technology
  • ITR Guide
  • Money Insights
Stock Screeners
  • Stock Screener
  • Break Out Stocks
  • Defence Stocks
  • Consistently Growing Stocks
  • Low Price Blue Chip Stocks
Top NSE/BSE Companies Share Price
  • Tata Motors share price
  • Tata Steel share price
  • State Bank Of India share price
  • HDFC Bank share price
  • Infosys share price
  • ITC share price
  • Wipro share price
  • NTPC share price
  • ongc share price
  • Adani Enterprises share price
  • Adani Ports and Special Economic Zone share price
  • Bharat Petroleum Corporation share price
  • Coal India share price
  • Bajaj Finance share price
  • ICICI Bank share price
  • Titan Company share price
  • Larsen & Toubro share price
  • Power Grid Corporation Of India share price
  • Asian Paints share price
Gold Price in Top Metro Cities
  • Gold Rate Today
  • Gold Rate in Dubai
  • Gold Rate in Chennai
  • Gold Rate in Kerala
  • Gold Rate in Hyderabad
  • Gold Rate in Bangalore
  • Gold Rate in Mumbai
  • Gold Rate in Noida
  • Gold Price in Delhi
  • Gold Price in Ahmedabad
  • Gold Price in Kolkata
Latest News
  • ‘Cancer, Alzheimer’s will be relics of the past’: Anthropic CEO’s 10-year AI prediction
  • From coughing blood to a ₹291 crore fortune: 8 life lessons from Yuvraj Singh
  • Stocks to watch today, Nov 12: Tata Power, Hindustan Copper, Bajaj Finance, and more
  • Stock Market Today: GIFT Nifty signals quiet start; Brent Crude at $92/bbl
  • Why ULIPs face headwinds: Market volatility, Irdai commission caps weigh on sales
Follow Us
  • Facebook Facebook Link
  • Twitter Twitter Link
  • Linkedin Linkedin Link
Download Apps
  • Play_stor Play_stor Link
  • Apple_stor Apple_stor Link
Indian Express Group
  • INDIAN EXPRESS GROUP
  • The Indian Express
  • Loksatta
  • Jansatta
  • Inuth
  • Ramnath Goenka Awards
  • Indian Express Hindi
  • IE Tamil
  • IE Malayalam
  • IE Bangla
  • IE Gujarati
  • Express Tributes
  • This website follows the DNPA’s code of conduct
Quick Links
  • T&C
  • Privacy Policy
  • CONTACT US
  • About Us
Copyright © 2026 The Indian Express [P] Ltd. All Rights Reserved
Market Pulse